

![]() Insights
Insights
Head of Technical SEO
Technical SEO
Last year, Google announced Core Web Vitals as the next official Google ranking factor, which will be coming into play in June 2021. It is unusual for Google to announce an update to the algorithm before it happens – normally, the algorithm changes and we see the effects retrospectively. It is likely this announcement was made due to the importance of these three signals, so that brands have plenty of time to update their website ahead of the update.
Web Vitals is an initiative introduced by Google to help webmasters deliver a good user experience. Core Web Vitals are three metrics within this which are designed to measure how web users experience the speed, responsiveness, and visual stability of a web page.
It is likely that these metrics will evolve over time depending on what Google deems most important to web users – as technology and internet usage changes, so will the factors that make a good user experience.
Right now, the three metrics that make up Core Web Vitals are:
This metric measures the loading performance of a web page by looking at the amount of time it takes to render the largest content element from when the user requests the URL – or more simply, how fast does the page load for the user. To be deemed “good”, LCP needs to happen within 2.5 seconds from when the page first starts to load. Between 2.5 and 4 seconds, the page will be given a “needs improvement” score, and anything from 4 seconds onwards is marked as “poor”.
Common issues that might cause a slow LCP include third-party scripts and large page elements such as images and videos.
FID measures a page’s interactivity, the time it takes between a user first interacting with the page (e.g. by clicking a link) to the time it takes for that interaction to be processed. Anything under 100 milliseconds is ranked as “good”, 100 – 300ms is “needs improvement”, and over 300ms is “poor”.
One of the most common causes of a slow FID is the use of large JavaScript files on a page.
CLS measures the visual stability of a web page: how quickly the page becomes stable. Have you ever gone to click a link on a webpage and the layout suddenly changes so you click on something else by accident? That’s a layout shift, and it can be extremely frustrating for users.
A measure of 0.1 is “good”, 0.1 – 0.25 “needs improvement”, and 0.25 and above is “poor”.
The main reason for CLS is the inclusion of images, ads and iframes without predefined dimensions and the use of dynamically injected content.
From June 2021, Core Web Vitals will be part of Google’s core algorithm, meaning your score will impact your organic visibility. Both mobile and desktop searches will be affected, and Google Top Stories will also be influenced by these metrics. Having a poor score in any of the three metrics might mean you do not rank as well as competitors who offer similar content but a better page experience: lower ranking means less traffic and less revenue.
Core Web Vitals scores are based on data from the Chrome User Experience Report (CrUX), which uses anonymized data from real people who visit your website. Data which comes from real users in the real world is known as field data, and it gives a more accurate view of real page experience than lab data, data which is measured with a controlled test under near-perfect conditions. When a developer is testing a website, they are usually on high-quality computers with good internet speed – factors which affect all of the Core Web Vitals metrics.
Using field data to score each metric gives a much more accurate view of your site performance as it takes into consideration factors like people using old phones or slow internet which can dramatically impact how your site loads.
There are several tools which can be used to measure Core Web Vitals. Each tool uses the same CrUX dataset but displays the data in different ways.
You can access your Core Web Vital report in Google Search Console (GSC); the report looks at all URLs that are indexed and identifies whether they are good, bad or needs improvement, and shows both mobile and desktop performance (as these can differ), including historical performance.
Google PageSpeed Insights (PSI) reports on page-level performance over the past 28 days. While the data in PSI doesn’t go as far back as GSC, the benefit of using PageSpeed Insights is that it offers suggestions on how to improve performance for the pages reported on.
Other tools (which are not so readily available, either due to being a paid tool or requiring more in-depth developer knowledge) that can be used to monitor Core Web Vitals include:
The problem with any of these tools is that the CrUX database only captures field data across a few pages, not every single web page. For websites with hundreds if not thousands of web pages, knowing exactly which pages are underperforming is crucial, as even just a small percentage of low scoring pages going uncaptured can have a negative effect on your overall site score.
Recognizing this issue for one of our large retail clients, we built and installed a custom script on their website. This measures the score across each Core Web Vitals metric on every single webpage and pushes this data through to Google Tag Manager and then to Google Analytics.
We then set up a custom report within Google Analytics which allows us to see the score across LCP, FID and CLS on every page.
We also built a Data Studio dashboard to help visualize this data in a more easily consumable way:
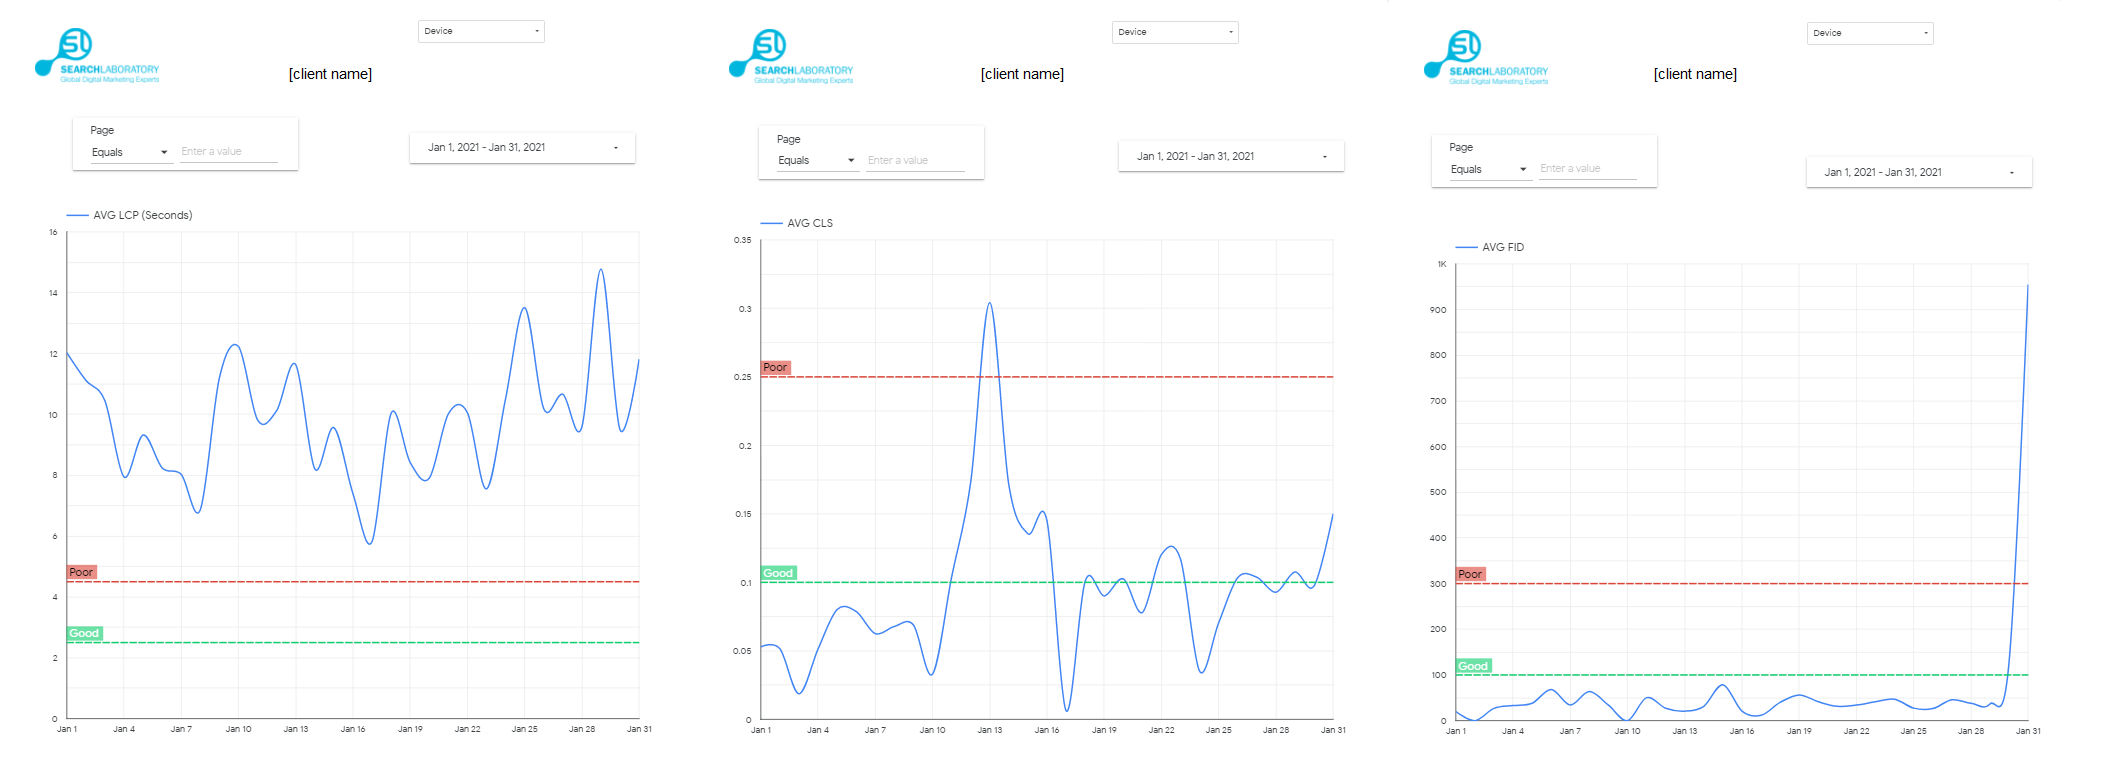
By comparing URLs which score badly in the custom GA report with URLs in the CrUX database, we can identify whether there are particular page types/ templates that perform badly and need to be rectified sitewide, or whether it is individual page issues.
![]() Insights
Insights

![]() Insights
Insights

![]() Insights
Insights