What’s changed?
As Google announced on 16th May, historical Quality Score data has now, finally, been made available to view within AdWords.
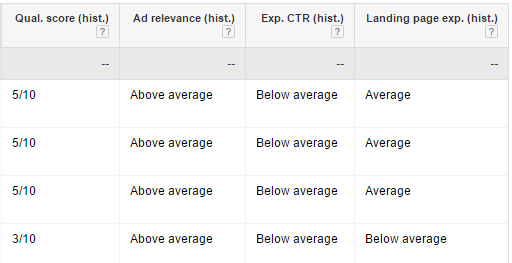
The change involves the addition of a new set of keyword metrics, allowing advertisers to track Quality Score changes back to mid-January 2016. The change also includes how Google’s assessment of the key quality factors have varied over time. The factors include:
- Ad relevance
- Expected click-through rate
- Landing page experience
See below for an example of the scoring:
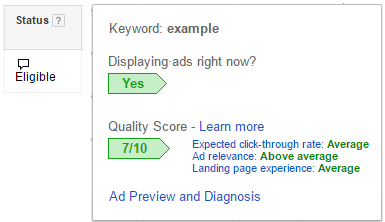
This breakdown of the Quality Score factors is particularly useful, since this information was previously only visible one keyword at a time by hovering over the keyword diagnosis button:
Having the capability to view and download this information is a massive improvement, and being able to view how it’s changed over time is even better.
One element that hasn’t changed is that this data is still only available to view at keyword-level, so to do any meaningful analysis, you will need to segment month by month and then export the data into Excel.
How to use all this data
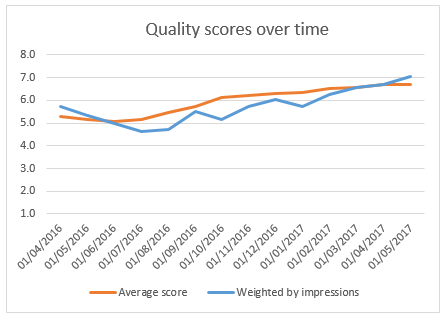
The most obvious application is simply to track how the quality scores have changed in a campaign over time. In this example below, we’ve plotted both the straightforward averages, and an average weighted by keyword impression volume to see how the two correspond:
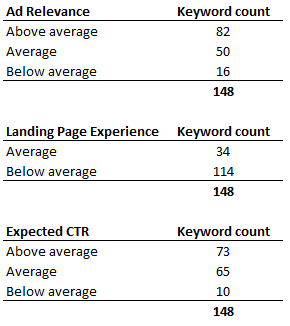
Once in Excel, it’s really easy to summarise the data with pivot tables; the snapshots below come from a campaign that is suffering with poor quality scores, and this summary makes it clear that landing page experience is a key issue that deserves further investigation:
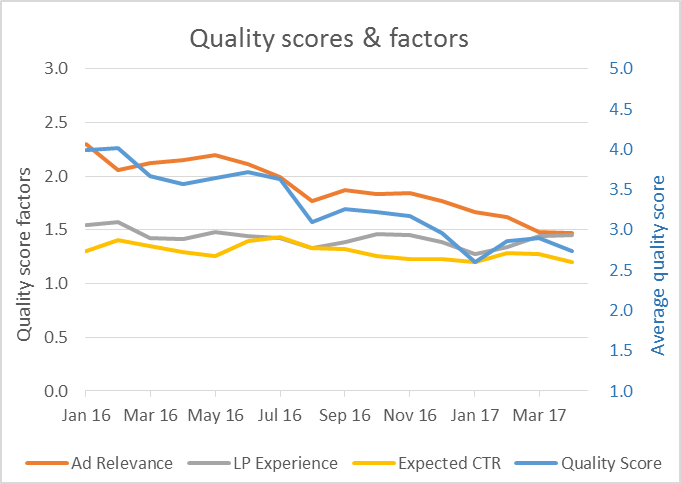
In this final example, the Quality Score factors have been converted to simple scores (with ‘below average’ worth one point, ‘average’ two points and ‘above average’ three points) and weighted by impression volume. Plotting these factors against the Quality Score over time shows a decline as ad relevance has fallen, indicating a need for ad optimisation in this particular campaign.
This new launch is a great – and long-overdue – new AdWords feature that will allow for far better diagnosis of Quality Score issues moving forward. The examples above are just a few ways that this new data can potentially be exploited. We look forward to discovering what other opportunities can be unearthed by such analyses in the future.
If you have any questions about accessing your historical Quality Score data in AdWords, please get in touch to speak with one of our experts.