Get in touch for further help with your unique dashboarding queriesGet in touch
We have used the standard set of dimensions and metrics, which should ensure that different GA data sources can be connected.
In the example dashboard an engagement is defined from the following GA segment.
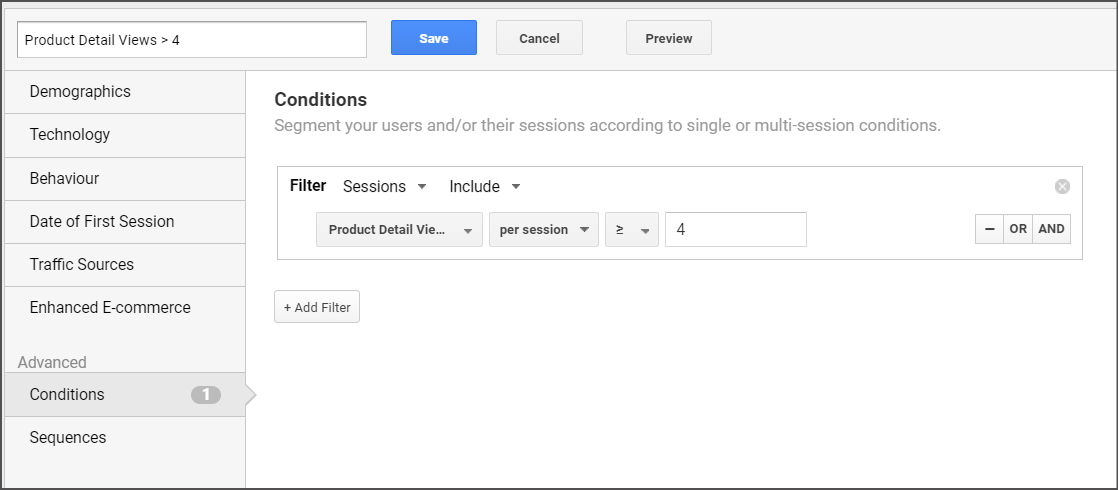
Custom segments are specific to the user who created the segment, so it will not work for other users when a new data source is connected.
You will need to create your own definition for an engaged session in a segment.
Remove the pre-existing segment and add your GA engagement segment to the relevant ‘Engaged Sessions Data’ charts on the right-hand side of the dashboard (within the sky blue block).
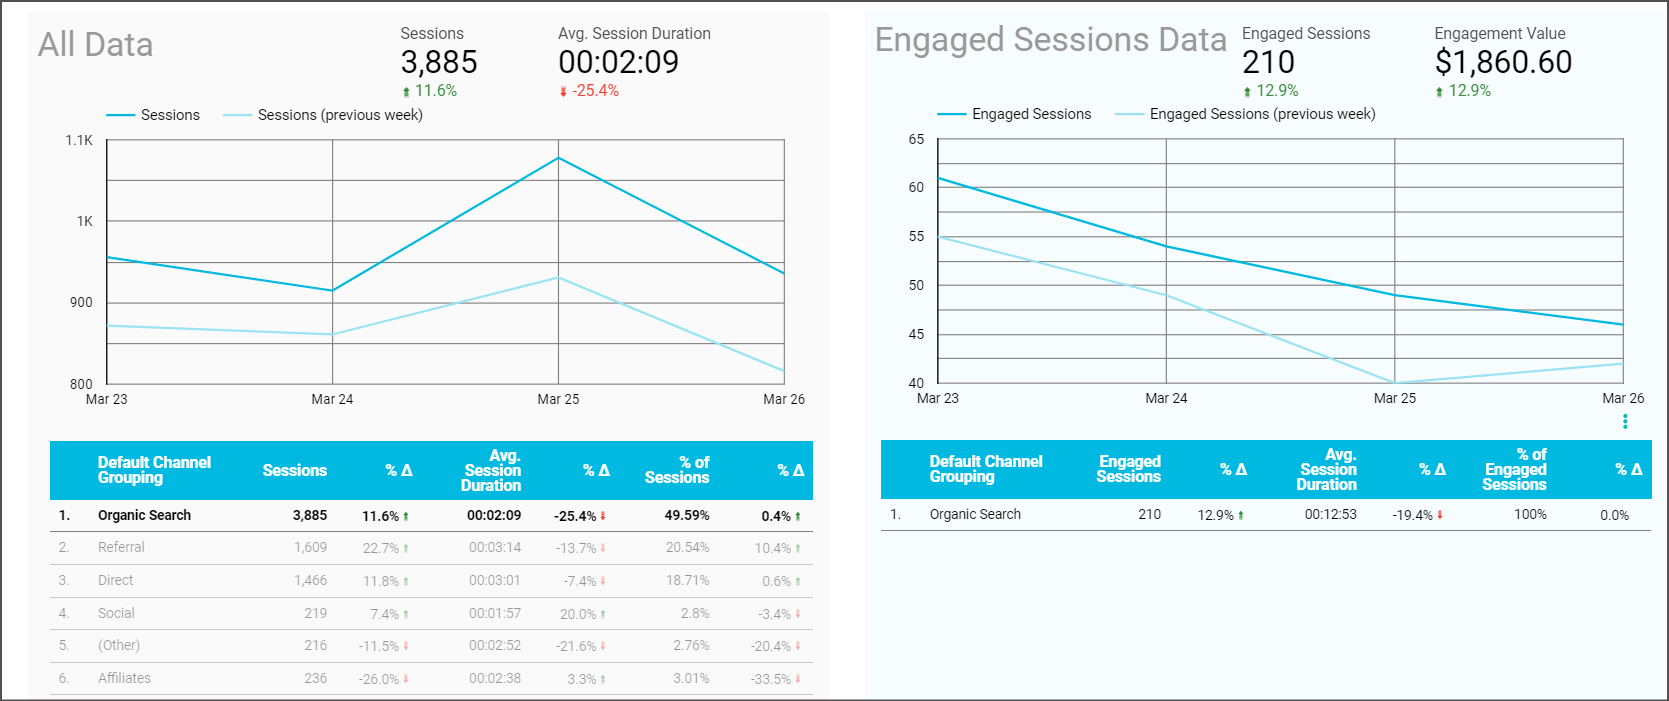
In this instance, an engaged session value was calculated from using February 2020 data. Total revenue divided by the number of engaged sessions. This figure (in this example it was 8.86) was then multiplied (in a calculated field) by the number of engaged sessions in order to get an engagement value. Please edit this calculated field with your own specific engagement value.

If you are using this method, please make sure you have your engagement segment applied to the chart / element.

This dashboard is very much a starting point to help direct people – segments aren’t the most robust way of measuring engagements. We would always recommend creating an event based on your engagement definition and creating a goal from this event. This will allow further calculations like ‘engagement rate’ and the like.
