In our increasingly visual culture it’s becoming more and more important to grab a reader’s attention and make your point, quickly. So in comes the infographic which is a great way to do just that. But now the internet is flooded with them, both amazingly good and incredibly dull, you need to put the work in to make them noticeable. But where do you start?
Here are five tips to creating an amazing infographic:
1. Collate the right data
Your data is the backbone of your infographic and it won’t succeed without it. Your data needs to hook the reader in and keep them interested. So make it intriguing or funny and choose a topic that’s relevant to your product or service. Choose an angle that people may not have thought of or use statistics to prove an old myth is wrong. The key is to make your infographic as thought provoking and original as possible. However, if you come across a topic that has been done before this can be as effective – just make sure you do it better.
2. Come to a conclusion
Before you start designing your infographic think about the conclusion of your findings and the point of view you want to represent. It is then easier to determine the focal point and come up with a great headline when you come to the design process.
3. Create a clever design
Now you’ve collated your data, make sure it grabs attention. Display your data in a simple yet creative way. Instead of using the typical bar or pie chart, design creative, relevant graphics to represent your findings. Use graphics where possible and avoid using large blocks of text as this takes time to read, defeating the purpose. If you have too much information, consider whether an infographic is the right way to represent your data – perhaps a blog post would be more suitable?

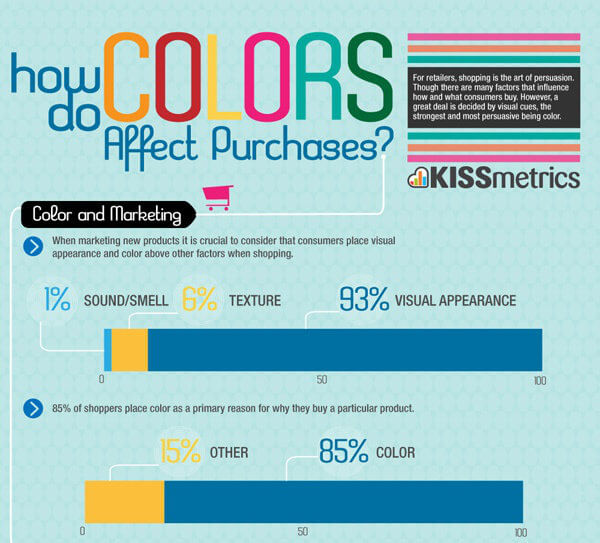
4. Get the colours right
When choosing your colour theme, choose up to five contrasting or complementing colours that don’t attack the senses. Avoid colours that are difficult to read such as neon on black and opt for a coloured background. A white background will leave people confused as to where the infographic begins and ends.

5. Make it easy to share
It’s important to target sites that are relevant to your niche. It’s tempting to put an infographic on as many sites as possible, but to get the full benefit these sites should be related to your subject area or business. A successful infographic will gain natural links through sharing, but this can only happen if it reaches the right audience.
Finally, when uploading the infographic onto your site, include the sharing buttons so that people can share it via social networks. There’s certainly no guarantee of an infographic going viral, and you shouldn’t create one solely with this in mind, but if people can’t share it easily they won’t.
So as long as your data is intriguing and relevant, your design is clever and you make it easy to share you should have a pretty amazing, and more importantly, successful infographic.
References: http://designsbytes.com/2011/03/16/35-great-infographics-for-website-designers-and-developers/ https://ceblog.s3.amazonaws.com/wp-content/uploads/2012/10/best-infographics-web-design.jpg https://s-media-cache-ak0.pinimg.com/736x/44/79/74/447974b7910004e37426e57cd54300e3.jpg


