
![]() Insights
Insights
Analytics and Data Science
As we launch head-first into the world of mobile-first indexing, the speed in which a website loads is more important now than it has ever been. Mobile web usage overtook desktop back in late 2016 and the gap has continued to increase.
Whilst desktop speeds and average mobile speeds continue to get faster, there are always huge gaps in coverage as well as slow-downs due to network over-capacity issues in high-density areas (city centres, arenas etc). Therefore, the bigger and more complex our websites become the more attention to page speed and performance we need to pay.
“[Page] Load is not a single moment in time — it’s an experience that no one metric can fully capture. There are multiple moments during the load experience that can affect whether a user perceives it as ‘fast’ or ‘slow’.”
 Shubhie Panicker, Google Engineer
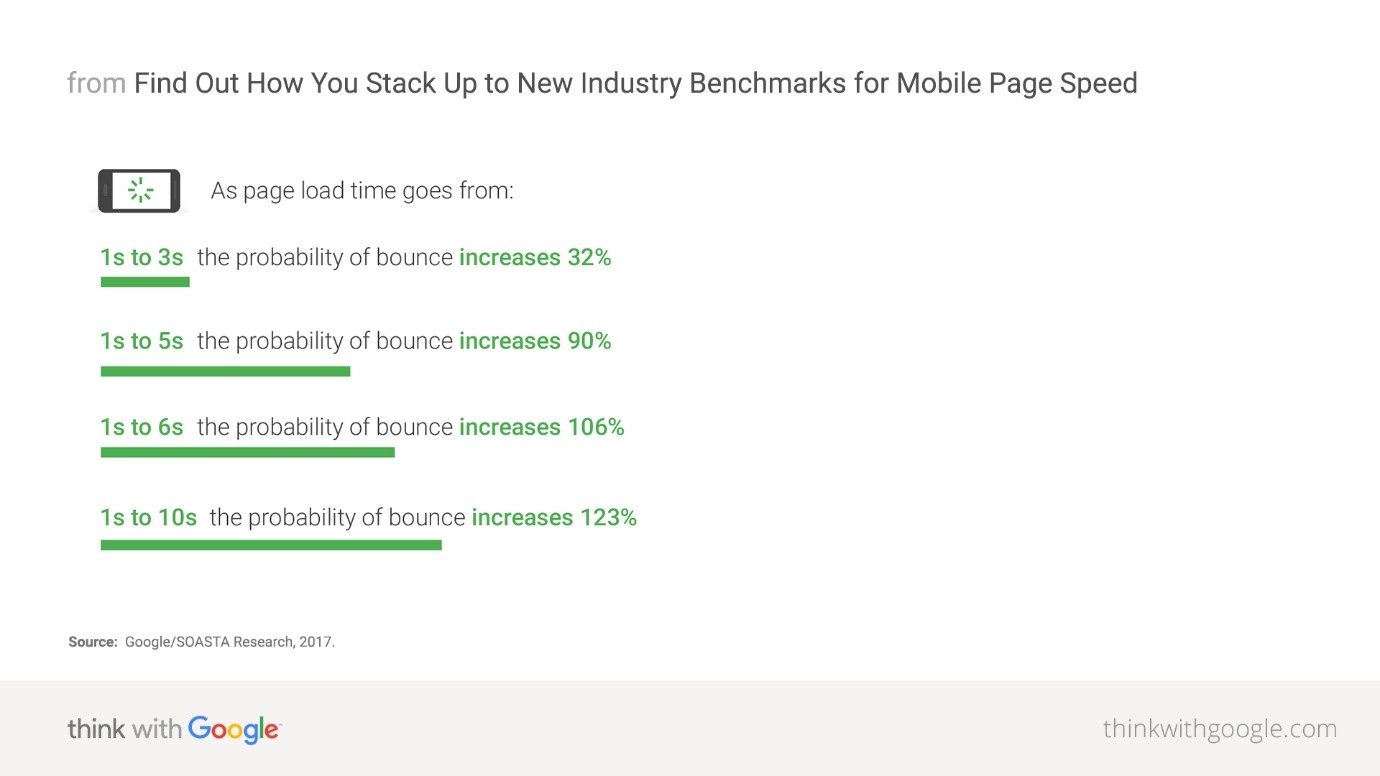
The following slide from Think with Google shows how the probability of bounce increases as the load time of your site increases:
The Time to Interactive (TTI) metric measures how long it takes a page to become interactive. “Interactive” is defined as the point where:
Source: https://developer.chrome.com/docs/lighthouse/performance/interactive/
Some sites optimise content visibility at the expense of interactivity however, this can create a frustrating user experience if a site appears to be ready, but when the user tries to interact with it, nothing happens. How many times has this happened to you?
What makes TTI a problematic metric is that no single tool or service can accurately paint a picture of your site’s true time to interaction. There are many variables that can affect TTI, including:
Your website might be built to ‘best practice’ but if your website user-base has a trend in location, browser etc, best practice can miss the mark resulting in poor performance and therefore poor conversions.
Therefore, to accurately paint a picture of interaction timings, we need to obtain mass-amounts of real-world user data; but how do we do that?
70% of websites use Google Analytics to measure traffic; therefore it makes the most sense to work the TTI metric into this data.
By implementing the Google Chrome Labs TTI plugin, we can start to push user TTI data through into Google Analytics using the User Timing functionality. Screenshots of how this looks within Google Analytics can be found further down in this post.
A few things to bear in mind before proceeding with this implementation:
<script>
    ! function() {
        if ('PerformanceLongTaskTiming' in window) {
            var g = window.__tti = {
                e: []
            };
            g.o = new PerformanceObserver(function(l) {
                g.e = g.e.concat(l.getEntries())
            });
            g.o.observe({
                entryTypes: ['longtask']
            })
        }
    }();
</script>
Use the version of code that matches your Google Analytics integration
Below is the TTI implementation if you are using the newer gtag.js:
<script type="text/javascript" src="[location-URL]/tti-polyfill.js"></script>
<script> ttiPolyfill.getFirstConsistentlyInteractive().then(console.log);
    ttiPolyfill.getFirstConsistentlyInteractive().then((tti) => {
        if (tti > 1) {
            gtag('event', 'timing_complete', {
                'name': 'TTI',
                'value': tti,
                'event_category': 'Page Speed'
            });
        }
    });
</script>
Below is the TTI implementation code if you are using the older analytics.js:
<script type="text/javascript" src="[location-URL]/tti-polyfill.js"></script>
<script> ttiPolyfill.getFirstConsistentlyInteractive().then(console.log);
    ttiPolyfill.getFirstConsistentlyInteractive().then((tti) => {
        if (tti > 1) {
ga('send', {
hitType:'timing',
timingCategory: 'Performance Metrics',
timingVar: 'TTI',
timingValue: tti
  });
        }
    });
</script>
Interested in receiving articles like this direct to your inbox? Sign up now
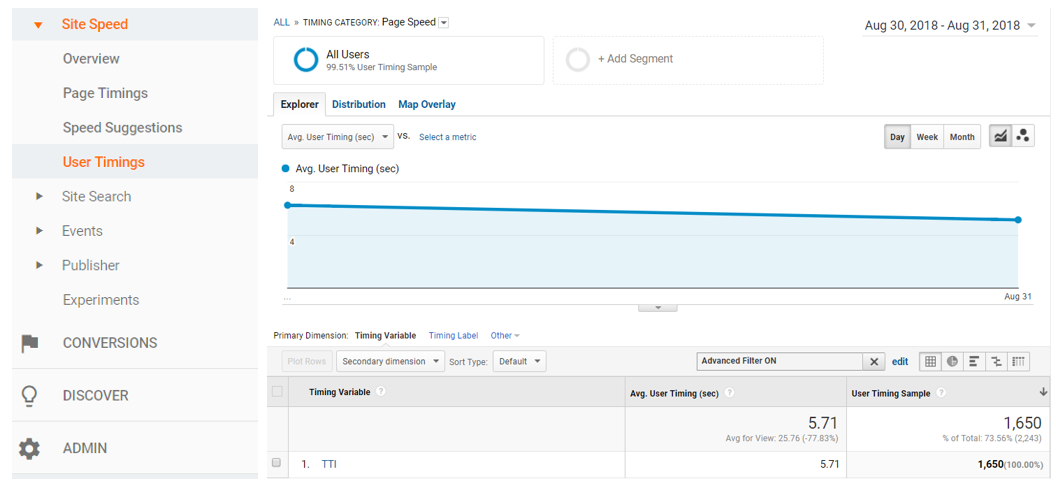
User Timing Dashboard showing average timing as well as sample size
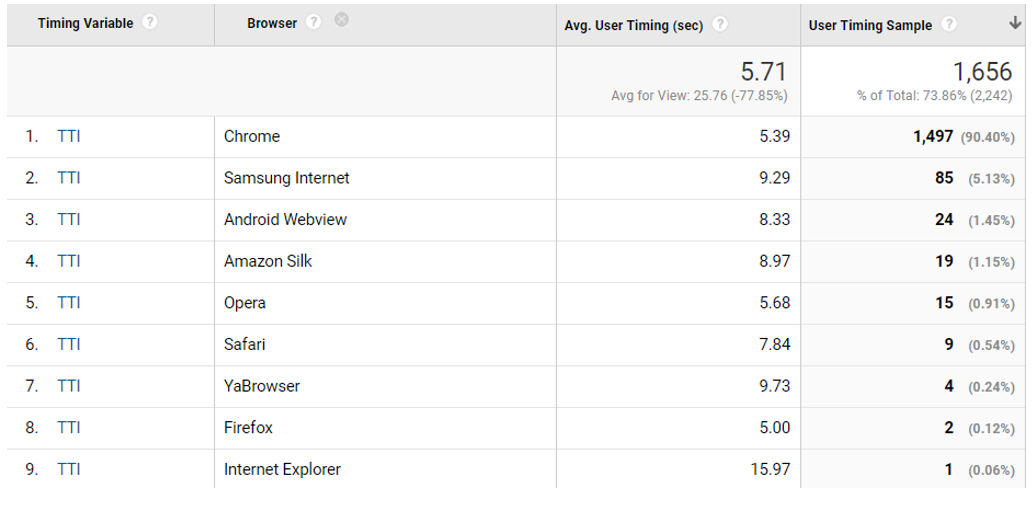
A breakdown of TTI, with sample size, for various browser types
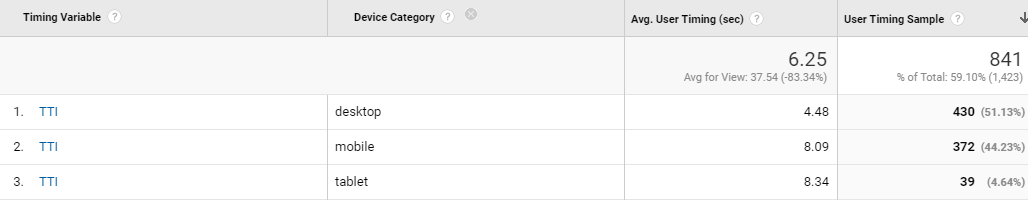
A breakdown of TTI based on Device Type (mobile, tablet and desktop)
If you need help with your Google Analytics implementation, we will be happy to help. Get in touch with us today.
![]() Insights
Insights

![]() Insights
Insights

![]() Insights
Insights