Tear Through PPC Report Data With Excel – 3 Tips To Get You Started
On first look, the mountains of data coming through your PPC Reports can be daunting for anyone. Excel is a great tool for making sense of the masses of PPC data available from your sources and bringing it to life. Excel is the board you can use to tame and explore that mountain, as well as carve your epic lines of analysis. Better yet, a well-constructed, all-mountain board of a spreadsheet is a great way to demonstrate the success of your hard work to clients.
Here are 3 practical tips and techniques to get a PPC Account Manager started and making the best of what Excel has to offer.
1 | Correct Your Stance For Beginner Users
Compatibility is essential for all clients. And as you wouldn’t set an aggressive stance for a grommet, don’t go full throttle on advanced 2007 formulae until you know all users are ready. The differences in the functionality of Excel versions mean that there are several formulae that are valid in 2007 but will return #NAME? errors when the spreadsheet is opened in 2003. See our previous blog PPC Using Wacky Excel Spreadsheets for more details. Also, simply because your direct contact uses a newer version of Excel does not mean that their colleagues do, and you will want your great work shown throughout the whole company. Best practise is: save time and play it safe, use only the formulae available prior to 2007.
If you do decide to use newer formulae, make sure that you are familiar with techniques valid in older versions of Excel that can replicate the functionality of your spreadsheet should the time come that you need to deliver an alternative.
2 | PPC Account Structure Is An Excel Tool
Tempting though it may be to name your campaigns after your epic hits such as Big Shaq and Raptor’s Ride, it can soon become impractical. Excel has a variety of text functions that can manipulate your data and help create some super useful fields within your data. This gives you the opportunity to use the names of your PPC Campaigns and AdGroups to create quite intelligent filters and charts in your spreadsheet. For example, if a Campaign is running in London, Leeds, and the rest of Yorkshire and you can separate Product and Brand AdGroups, using some unique characters and some simple text formulae will help you create criteria for IF functions.
Given this client I’d create the following structure and apply these formulae in Excel:

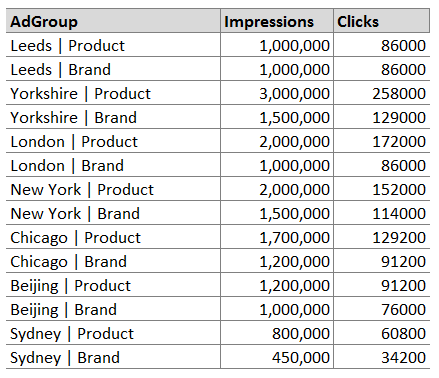
With some very quick text manipulation using TRIM, LEFT, RIGHT, LEN and FIND, Excel is capable of giving your report data rows some useful attributes or tags. The result is a very practical set of criteria which can be used in your reporting in formulae like this:
=SUMIF( Location , “Leeds”, Impressions ) which would return 2,000,000
=AVERAGEIF( Type, “Brand” , Clicks ) which would return: 100,333
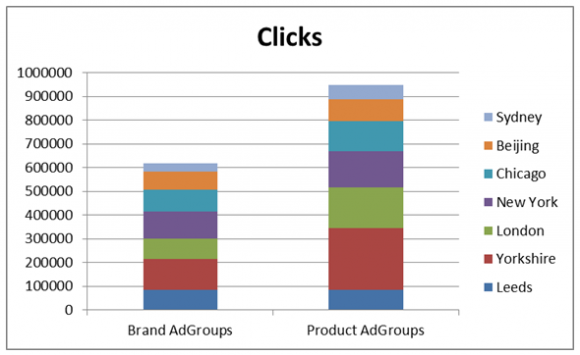
The great thing about applying this type of naming convention is that it is becomes very easy to create and display data, in both tables and charts. Furthermore, using this method allows you to simply construct advanced tables and charts which are very easy to adapt and expand as the scope of your campaign grows.


3 | Spreadsheets at Warp-Speed
A long-managed and complex account is bound to accrue masses of data and eventually your spreadsheet will grind to a halt like a chairlift in a high wind. Good news though buddy, there are several tricks to improve your spreadsheet in order to keep it fast and usable in the long-term. A bonus though, is that by focusing on calculation speed you can ensure that when the spreadsheet is run in older versions of Excel it remains sharp and sleek. Here are just a few tips you can follow:
- Referring to whole columns in a calculation is slow. Where possible, create specified ranges with absolute cell references or dynamic ranges using COUNTA and OFFSET. This reduces the amount of data Excel will have to evaluate when calculations change. But do use caution: if ranges from the same worksheet of an equation do not have the same number of rows, formulae will either omit data or return an error.
- Use numbers where possible and use TRUE() and FALSE() in calculations, Excel handles numbers much more quickly than text. Try to create IF calculations where number conditions and logic is used.
- If you can avoid using volatile functions such as TODAY(), INDIRECT() and INDEX(), do. For most cases there are quicker alternatives such as CHOOSE(). However, if you have to use volatile functions, calculate them only once and have all other instances refer to this single cell as a value.
- Database functions such as DSUM, are great at calculating formulae on large amounts of data very quickly and allow you to calculate IFs with multiple criteria even in Excel versions prior to 2003, on top of which they are very simple to set up.
Summary / TL;DR:
Excel is the perfect tool for most PPC duties, most-of-all reporting. Make sure your calculations are compatible with all your users’ and clients’ versions of excel, taking care of the major differences between 2003 and 2007. Good PPC Campaigns and Account Structure can give you a head start in designing your spreadsheet tables and charts. And finally, keep it all-mountain; simplicity will deliver speed and compatibility.


