
![]() Insights
Insights
Digital Strategy Director
Analytics and Data Science
If you outsource work to an agency or agencies, it’s likely that you receive a report per channel. Single channel reports, while useful for seeing how they meet their channel specific KPIs, do not communicate the bigger picture – for example, where one channel fits in to the wider customer journey, or how results relate back to wider business goals.
We developed our own bespoke reporting solution, ReportLab, to provide our clients with flexible reporting which allows stakeholders to see the true business impact the activity has. You can read more about the benefits of ReportLab here.
For simpler applications, Google Looker Studio can give you control over your reporting approach. In this blog, we will discuss the benefits of using Google’s reporting dashboard: Google Looker Studio.
Google Looker Studio is a bespoke dashboarding and visualisation tool which can be used to build customised reports from raw marketing data.
With most, if not all, marketing platforms and tools offering their own reporting solutions, you may be wondering if it’s worth making the move to Looker Studio.
Looker Studio makes it easier and quicker to:
Looker Studio is also very accessible; anyone with a Google account can be granted different levels of permission, meaning various stakeholders can access or edit reports depending on their needs.
Read on to see five reasons why Google Looker Studio can help you to create insightful marketing reports.
One of the most compelling reasons to use Looker Studio is its ability to connect with an almost unlimited number of data sources.
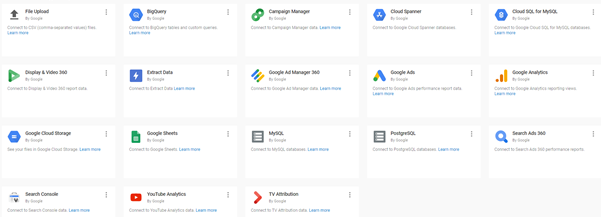
Looker Studio has 18 Google Connectors which have been built as part of Looker Studio, including:
In addition, there are 149 Partner Connectors that have been built by third-party platforms which can be used to connect to additional data sources like Bing Ads, Snapchat, Salesforce and more.
Thanks to these connections, Looker Studio can be used to report on almost any marketing activity undertaken, making it easier to create reports which reflect all of your marketing efforts and results.
We can set up Looker Studio’s Google Connectors to automatically pull in fresh data, producing real-time dashboards and reports. This is extremely beneficial in ensuring potential issues are flagged and tackled before complications arise. For example, a profit report might show that you are set to underperform one month, so you might decide to increase PPC spend in order to hit profit targets.
Real-time reporting also ensures you are able to provide up to date answers to any questions stakeholders might have, as and when they occur.
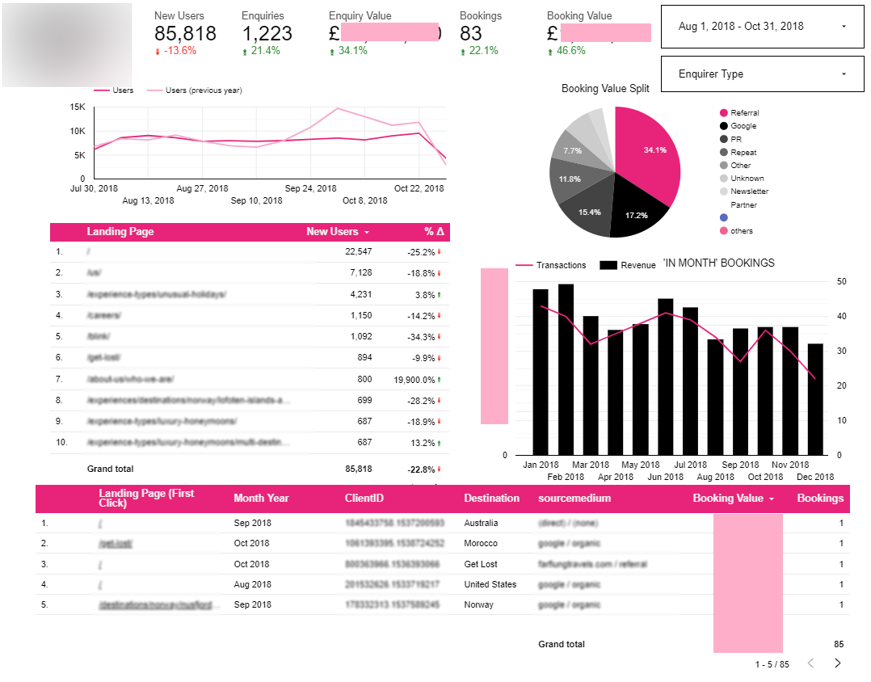
Every aspect of a report in Looker Studio is 100% customisable; the layout, the colours, the type of graph used, etc. you can even create custom metrics and dimensions in Looker Studio: this is particularly useful in cleaning campaign tagging and aggregating data to make analysis easier.
Being able to build bespoke reports means you can make better use of the data to tell a compelling story, which is often the key to getting stakeholder buy-in.
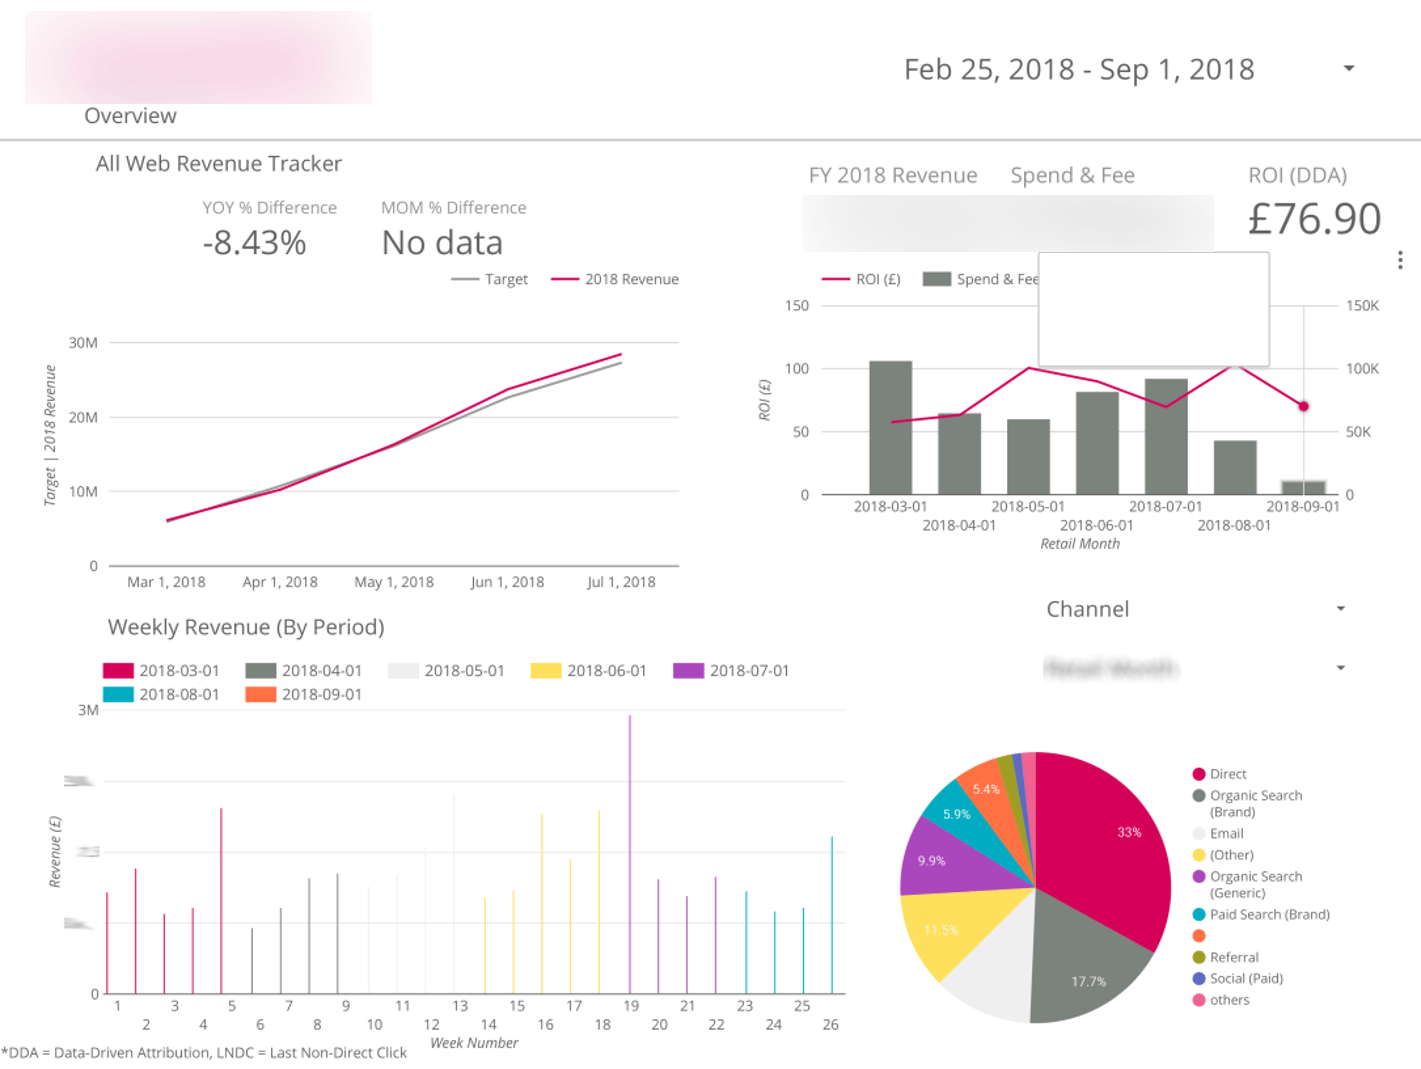
You can build charts and reports in Looker Studio that blend data from different sources – an ideal solution for brands who have an integrated strategy or want to see how individual channels are contributing to wider KPIs. To blend data, all you need is two or more datasets that have a dimension in common (known as the ‘key’): e.g. impressions or userIDs.
These datasets can then be combined to create blended reports to compare performance across platforms or see how each platform contributes to objectives and goals – insights which are helpful when making budget decisions.
Looker Studio can be shared and accessed in the same way as any Google document, which means it’s easy to grant the correct level of access for any stakeholders who might be interested in viewing the report, and any marketer or team member who might need to edit the reports. Filters can be applied to alter the data which is available to viewers, which means stakeholders are able to quickly access the exact data they are interested in (without the need to make multiple reports).
Integrated reporting dashboards are a more effective way of communicating the true value of your marketing activity. If you need help creating a Looker Studio dashboard which reflects your business goals and objectives, get in touch. You can also read more about our Looker Studio offering here.
Get our latest insights delivered to your inboxSubscribe to our newsletter
![]() Insights
Insights

![]() Insights
Insights

![]() Insights
Insights