
![]() Case Study
Case Study
Mars Petcare is a global manufacturer of pet food and provider of animal care services. They sell a large volume of products through Amazon via both paid and organic listings.
Many of Mars Petcare’s products rank on Amazon organically and we believed that they were paying for traffic through Amazon ads that they would have received for free in the UK market.
We needed to identify the incremental return on ad spend (iROAS) to quantify how much revenue cannibalisation was occurring as this would allow us to determine paid strategies to achieve optimal sales without paying for traffic which they would achieve organically.
![]()
The work we did for Mars Petcare was shortlisted in 2020 for the Most Effective use of Data or Insights category by The Drum Marketing Awards.
Although we had access to historical paid and organic Amazon data for 700 products across 16 brands in the UK, the data covered a time period where the channels were ‘competing’: we needed to see how organic performed when paid advertising was paused.
We suspended all paid activity for two weeks to identify how organic performed by itself without cannibalisation. We then measured how much organic revenue was lost when paid advertising resumed. We worked this out by subtracting the actual organic revenue from the test organic revenue (taken while paid activity was suspended).
As we only had two weeks’ worth of revenue for the test figure, we needed to forecast what organic revenue would look like without paid activity over a longer period of time. We used 14 months of historical organic revenue data at a product level (to understand seasonality and growth) and the test period revenue to forecast revenue.
We chose a forecast model which uses a form of time series decomposition called Holt-Winters exponential smoothing to produce forecast values based on historical patterns. This process looks for a long-term trend – is revenue increasing or decreasing and at what rate – and seasonality – are there regular peaks and troughs over the time period?
Finally, it attaches more weight to more recent observations than to earlier ones, working on the assumption that more recent data is more indicative of the future than older data.
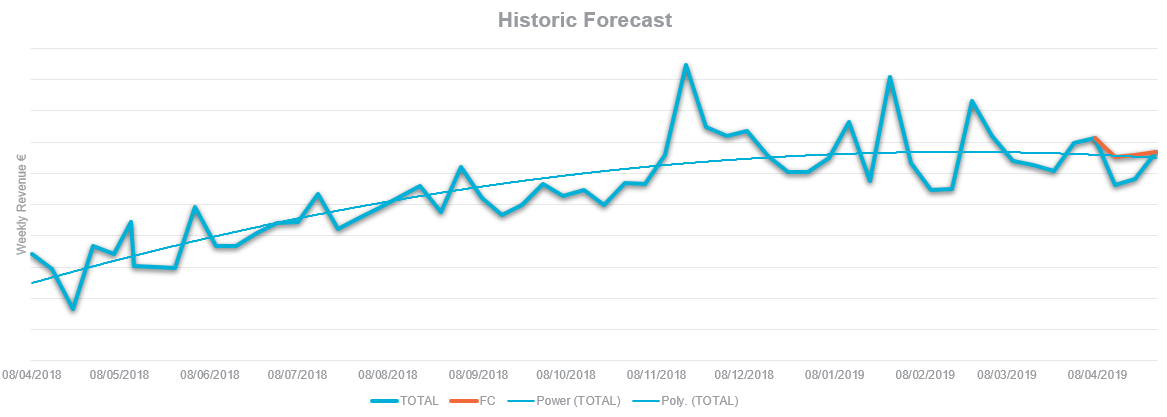
This chart shows a test of the forecast model. The blue line shows organic revenue over time. We used this data, excluding the last three data points where the orange line begins, to predict the final three values shown by the orange line so that we could see how close the model’s predictions were.
The actual revenue drops away before recovering, which was not projected in our forecast. This is likely down to a number of significant peaks and troughs in the revenue which are not seasonal and are therefore hard to predict to an exact amount. Despite this, the model’s projection closely follows the long-term trends and is suitable for use.
Once we had established a forecast model, we ran separate forecasts for each Amazon Standard Identification Number (ASIN) and combined these to produce a singular forecast. The individual ASIN data is noisier, with larger peaks and troughs and movement over time. Forecasts at this individual level could be heavily influenced by recent fluctuations, but the Holt-Winters model smooths out this noise and we can see that the aggregated values cohere tidily to the long-term trend.
We looked at the following metrics over a four-week comparison period:
We calculated each metric at a product level, allowing for aggregation by brand and overall. The data determined that 46% of paid revenue was incremental paid revenue, while 54% would have gone to organic listings if paid ads were not active – meaning the ROI for the paid activity was under half of what had been previously reported. The figure varied significantly across products and brands.
Using this data, plus further information from Mars Petcare such as profit margins on individual products, we were able to calculate incremental profit and segment on product class or packing technology.
We used these insights to build paid strategies for each brand, allocating budget across defensive, generic and competitor campaigns to achieve the highest overall iROAS for each brand.
Since implementing new strategies, we have increased the overall iROAS by 11.26%.
Getting the best ROAS from your data?Download our workshop to see how retail data can drive true growth
![]() Case Study
Case Study

![]() Case Study
Case Study

![]() Case Study
Case Study