How can you predict the potential market size of a viral campaign? Imagine you are hoping to initiate a viral campaign for a client. You’ve produced some great content, perhaps a highly polished infographic, and need to give your client some figures – how many people are going to see this, and their brand logo? Of course, this depends on a few different factors.
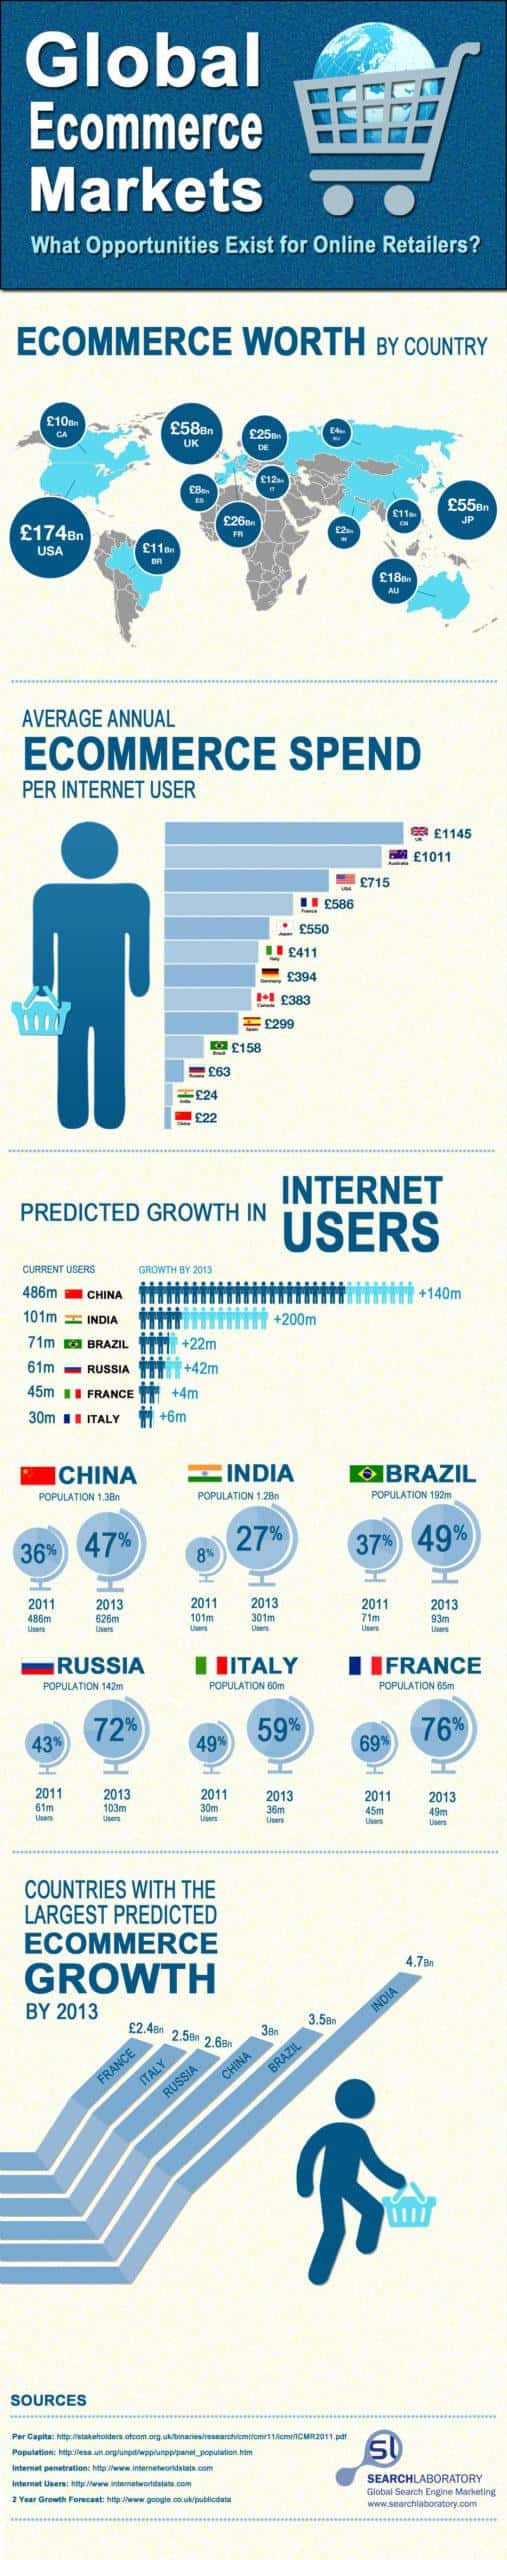
Firstly, what is the total market size for people who might be interested in this? For the infographic on the right, we are hoping to be visible to search marketers, ecommerce companies, and retailers yet to move online. This is a large group of people, and we can conservatively estimate this number at 500,000.
The second and third figures we need are the share rate – how many people upon viewing the graphic will retweet, share or otherwise spread it around, and also a decay rate – this figure is the average number of days before a persons tweet or Facebook share falls off the page, and is no longer seen by other members of their network.
Estimating parameters
Coming up with values for these parameters isn’t easy. For the share rate, we must think about typical consumer behaviour. How often do you share content? Who of your connections has shared things from your Twitter, Facebook or website? This figure will vary a lot depending on the type and ‘stickiness’ of the content, medium of transmission, etc. and is the key parameter in arriving at the probability that a campaign goes viral. For now lets assume that for everyone who shares the content, a further three people will pass it on.
For the decay rate, we will assume that the content drops off the page after an average of two days. To be able to use this figure, we actually want the number of drop-offs per day, which is 1 divided by two days = 0.5. There is a final figure we need, the number of people who share the content initially. Of course, getting your material onto several websites, or tweeted by people with large numbers of followers will help your campaign. Once we plug the other values in, we can see what difference our initial number of sharers will make.
The Stochastic General Epidemic Model
We will use mathematics developed to predict the spread of epidemics, which is what gave viral marketing its name, due to the way content spreads through a network. Using the model for a stochastic general epidemic, the figures we have are analogous to the total number of people who may be infected, the infection rate, and the recovery rate. This is a fairly simple model which omits a number of factors, but allows us to quantify the reach of a campaign with just a few bits of information. Two figures we can obtain are:
- The probability that our campaign will not go viral – the chance of failure. This describes situations where the campaign did not reach critical mass, and the content withered and died. Knowing this value, we can change our number of initial sources to avoid it.
- The maximum number of people who will see the content. This enables us to forecast the likely size and success of the campaign. The absolute total is simply our estimate of the market size; this figure is the maximum simultaneous number of people reached – those actively sharing or viewing the content at one time.
The equations needed to arrive at these values are: 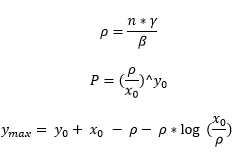 Where:
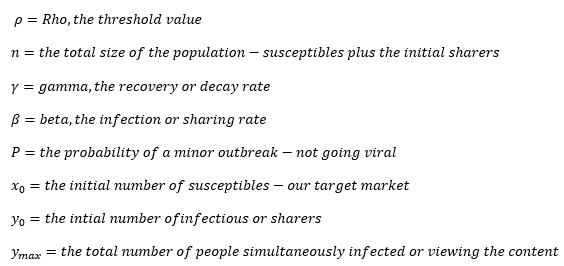
The value I describes the threshold value for the initial number of susceptibles. If an infection is introduced, then the number infected decreases and the infection dies out – our campaign has not gone viral! Conversely, if then the number of infectives builds up and an epidemic breaks out. For more information on how these equations are derived, check out:
https://en.wikipedia.org/wiki/Compartmental_models_in_epidemiology#The_SIR_model https://royalsocietypublishing.org/doi/10.1098/rspa.1927.0118
Plug in our numbers
Using the figures we arrived at earlier, and assuming we will share the content initially ourselves without any assistance (y_0=1), we have: 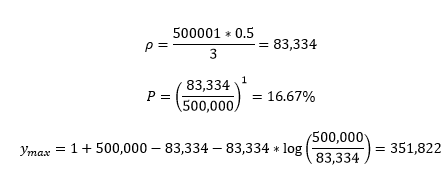 So, we have a theoretical maximum simultaneous audience of 351,822 people, but a 16.67% – or 1 in 6 – chance that the campaign will not go viral, and will fade away quickly. The total market size sounds pretty good, but the risk of failure seems too high – how many initial sharers, or seeds, do we need? We can try a few values by plugging the equations above in to Excel. The table below shows a few different combinations:
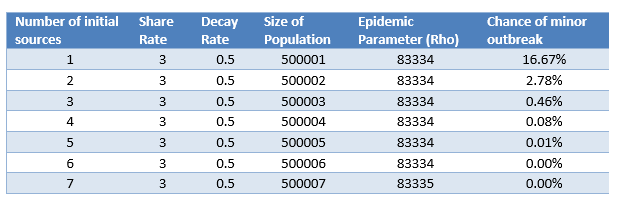
So, it seems that 6 initial seeds will be enough to ensure our content goes viral. Of course, that makes it sound very simple to do but this is based on our estimated parameters – if our share rate is not 3, or our decay rate is higher, we will not achieve these figures. As ever, the quality of the content will dictate what happens.
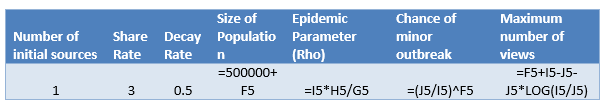
Above are the formulae required, adapted to be used in Excel. By plugging in different values for the number of sources, share rate, decay rate, and size of population you can see how the % chance and maximum number vary. Notice what has the biggest impact on the maximum number – the decay rate, and the biggest impact on the chance of minor outbreak – the share rate.
Conclusion
This model is a simple approximation of a viral marketing campaign but hopefully highlights the right ideas – when putting together content, think how can I increase the share rate? How can I reduce the decay rate and prolong visibility? And how much work should I put into seeding this content to give it a reasonable chance of going viral?