Our research shows that building an attribution model that identifies the sources of your most valuable website traffic is a challenge faced by up to 75% of digital marketers.
Correctly assigning credit to the different steps people take en route to making a purchase allows you to identify the sources of your converting traffic, work out the ROI of your marketing channels, and investigate problems in low performing areas. Get it wrong and you’ll waste budget on the wrong campaigns and get poor quality leads.
This case study explains how we use Google BigQuery and Google Analytics 360 to build an attribution model.
Shortcomings with the attribution models built into Google Analytics
Google Analytics is the market-leading free analytics software, and has several attribution models built in. However, they are all open to challenge.
Last interaction
The ‘Last Interaction’ attribution model reports on the last source that drove converting traffic to your site.
But what if a customer saw a PPC advert two weeks ago, and has been visiting your site by navigating directly to your home page ever since?
In this instance, the Last Interaction model would only attribute credit for the sale to the Direct Channel, missing the reality that it was the PPC advert that first attracted the customer.
Last non-direct click
An alternative is the ‘Last Non-Direct Click’ model, which ignores the Direct channel.
But what if in the scenario above, having clicked on the PPC advert the user subsequently signed up for your email newsletter, and the Last Non-Direct Click was from a promotional article in your newsletter?
In this scenario, the email channel would get the credit, and again you would not be aware of the value of the PPC advert which generated the initial visit.
First interaction
Some people use the ‘First Interaction’ model, which in the above scenario would give all the credit to the PPC advert.
But this would ignore the hard work done by your email newsletter team, which kept the user engaged and subsequently led to the purchase.
Linear
Another option is the ‘Linear’ model, which attributes equal value to each ‘touch point’ made by a customer en route to making a purchase.
Whilst this sounds effective, and is a step up from First Click or Last Click, it still wouldn’t paint an accurate picture.
If, as in the example above, a customer comes to the site through a PPC advert, visits our site twice directly and finally buys something after clicking on a link in an email, this model would attribute 25% to PPC, 25% to email, and 50% to Direct.
However it would be more accurate to attribute a higher % to PPC (which captured the original contact) and to Email (which triggered the conversion) than Direct, which may have had no impact on the decision-making process.
Building a custom attribution model using BigQuery and Google Analytics 360
Google Analytics allows a degree of attribution model customisation within its web interface. However, more flexible and powerful solutions can be built using BigQuery and Google Analytics 360.
This combination allows us to create attribution models that are based on our clients’ specific business needs and objectives: bespoke models focused on generating the most useful insights and the highest possible returns for our clients.
What is BigQuery?
BigQuery is Google’s solution to the challenge of managing big data. It can sort through massive amounts of data in seconds and has a “pay for what you use” billing model. It has an easy to use web based UI, providing an interface familiar to any database developer. We can also connect several reporting applications to it, such as Google Data Studio and Tableau.
The benefits of Google Analytics 360 and BigQuery
As part of Google Analytics 360, you can select which view is exported to BigQuery. If you choose the unfiltered view, the Google Analytics data is transferred into BigQuery at hit-level. This means we get a record for every page a user visits. With such a large amount of data available, it is possible to gain an insight into customers and their on-site activities.
Another advantage of using BigQuery is its ability to work with many third-party reporting applications. If required, you can use the APIs to integrate it with your own custom-built software.
Importing the data
To build the custom attribution model, our development team create an SQL query to get the information we need from the previous day’s data. The query runs daily and gathers information about which channels have driven traffic to the site that subsequently resulted in a conversion.
Preparing the data
To prepare the data for analysis, we use the Channel Grouping column to store the referring method for the session (e.g. PPC, Email, Direct, etc). The traffic source data can alsobe used to report on the source in even greater detail, and find out which ads or email campaigns are performing the best for the client’s website.
Cross device sessions
To build models based on cross device sessions, you can make use of the UserID field, generated by your website or CRM when a user logs in. For more information on the UserID field and how to implement it see our blog post on pushing CRM data back into Google Analytics.
Adding in attribution weightings
The next step is to customise the solution based on the client’s unique attribution weighting model. We hold this in a Google Sheet to make it easily accessible, and it will look something like this:
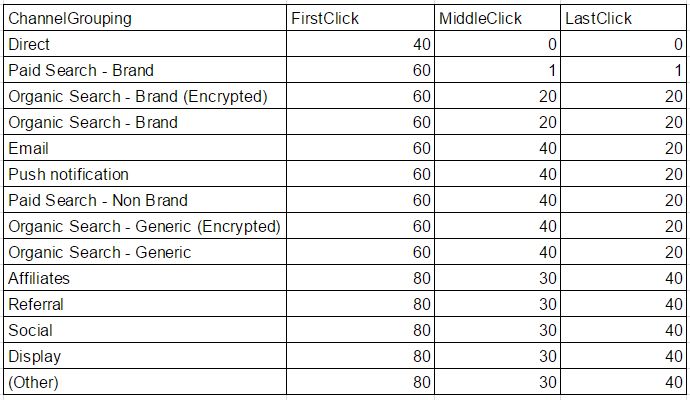
This sheet consists of the following columns:
- Channel Grouping – The name of the channel sending traffic to our site.
- First Click, Middle Click, Last Click – three columns where we can assign scores to the channel depending on where it fell in the user’s journey. For example, some models may give a high score to the first channel in the user’s journey, whereas some give a higher score to the last. You could extend this for your model for first, second, third, fourth visits etc.
This Google Sheet is then linked to BigQuery and used to attribute score weightings to different channels depending on where they appeared on the user’s journey. The Sheet also allows different reports to be defined with different weightings, so new reports could be added if required.
Building the query
- First, we need to get a list of all sessions for users who made a transaction the day before. For cross-device tracking, we build a separate list of UserIDs and visitor IDs to be able to join the users’ sessions together.
- We then work out where each session was on the users’ journeys, (first, second, third, last etc.) There are several ways to do this but we used the Window functions to calculate the visit number and the total number of visits. We need to calculate this for ourselves rather than using the VisitNumber field provided by GA, as the users’ first visit may be outside our attribution window, and it won’t work if we are tracking across devices.
- Using the attribution weighting data, we assign a weighting to each session based on the channel and where it fits in the journey.
- Finally, using the weighting assigned to each part of the user journey we allocate a percentage of the conversion count and conversion value.
Output
This gives you a list of each session leading up to the user’s conversion together with:
- The referring channel for the session
- The visit count, and number of visits to each channel
- The weighting score for each channel
- The percentage of the conversion attributed to the channel
- The number of sales converted from the channel
- The revenue generated by each channel
Here is an example of the output, where Gross Margin and Gross Profit have been added. This information allows Marketing teams to calculate a return on investment for each channel.
|
VisitId |
TransId | Revenue | Channel | Visit No. | Visit Count | Score | Channel weighting % | Number of Sales Generated | Revenue | Gross Margin on Sales % |
Gross Profit |
| 123456 | ABC123 | 200 | Paid Search | 1 | 4 | 80 | 44.44444 | 0.444444 | 88.889 | 50 | 44.444 |
| 123456 | ABC123 | 200 | Organic Search | 2 | 4 | 30 | 16.66667 | 0.166667 | 33.334 | 50 | 16.667 |
| 123456 | ABC123 | 200 | Direct | 3 | 4 | 10 | 5.555556 | 0.055556 | 11.111 | 50 | 5.5556 |
| 123456 | ABC123 | 200 | 4 | 4 | 60 | 33.33333 | 0.333333 | 66.667 | 50 | 33.3333 |
If this was the only transaction for the day (hopefully not!) then we can determine that Paid Search was responsible for 44% of our business, 0.44 of our sales for the day, which generated revenue of 88.89 and gross profit of 44.444.
This information can be fed back into the ongoing optimisation of each marketing channel.
Summary
An attribution model is an important tool to use when making decisions on marketing planning. Using the data, you work out the ROI per marketing channel and plan your marketing budget accordingly. By implementing a custom attribution model as described above, you can build a flexible model rather than having to use a predefined one which may not be suitable for your specific needs. Using Google Analytics 360 and BigQuery make this easier than ever.