Many of our clients want us to deliver an online PR campaign that goes viral.
No, that’s not true.
All of our clients want viral campaigns. Instant online fame, brand recognition, more orders than we can cope with – we all want that don’t we?
Of course, going viral requires more than skillful planning and flawless execution: it also requires some luck to catch the zeitgeist of the moment, or get a share from an online celebrity.
However, our teams don’t like relying on luck. And our clients don’t like speculating their marketing budgets on the spin of a roulette wheel.
So our creative PR team got together with our data analysts, worked out a formula to increase the odds of success, and tested it on one of our own campaigns. This is the result.
Step 1: predicting the potential market size of a viral campaign
There are a few factors to consider when planning content campaigns, especially if we want them to be seen by as many people as possible:
What is the total market size for people who might be interested in the content?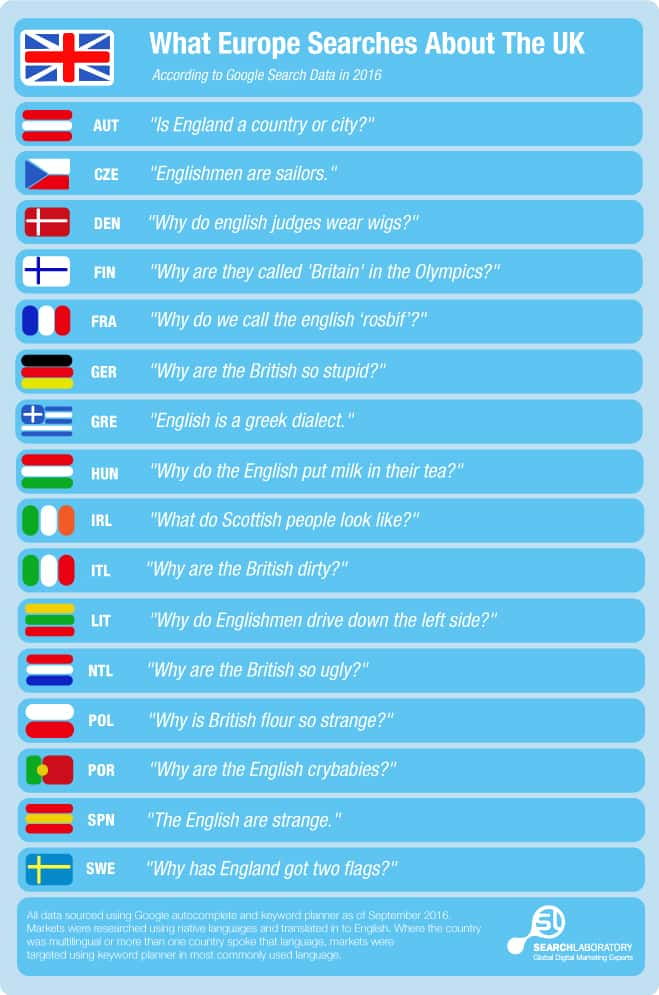
As this infographic of our content suggests, our aim was to be visible to the general population, through coverage on national media publications, and in multiple markets.
This is a large audience size and we can conservatively estimate this number at 10,000,000.
Step 2: estimating parameters
What is the share rate?
The number of people who, upon viewing the content, will then share it with their network.
What is the decay rate?
The average number of days before a person’s tweet or Facebook share falls off the page and is no longer seen by other members of their networks.
Obtaining values for these parameters isn’t easy. For the share rate, we must think about typical consumer behaviour:
- How often do you share content?
- Which of your connections has shared things from your Twitter, Facebook or website?
This figure will vary depending on the type and ‘stickiness’ of the content and the medium of transmission. The share rate is the key parameter in arriving at the probability that a campaign goes viral.
For now, let’s assume that for every initial publication who seeds the content (a catalyst site), a further 200 people will share it.
For the decay rate, we will assume that the content drops off the page after an average of two days. To be able to use this figure, we actually want the number of drop-offs per day, which is 1 divided by 2 days = 0.5.
There is a final figure we need; the number of people who share the content initially. Getting your material onto several websites, or tweeted/shared by influencers with large numbers of followers, are essential steps for campaign success.
Once we plug the other values in, we can see what difference our initial number of catalyst publications will make.
Step 3: applying the Stochastic General Epidemic Model
Applying the mathematical model that was developed to predict the spread of epidemics made sense: after all, that’s where the term ‘viral’ comes from. In short, the model explains how content (or a ‘virus’) spreads through a network.
So, using the model for a stochastic general epidemic, the figures we have are analogous to the following:
- The total number of people who may be infected
- The infection rate
- The recovery rate.
This is a simple model which omits a number of factors but allows us to quantify the reach of a campaign with just a few pieces of information. Two figures we can obtain from this methodology are:
The probability that our campaign will not go viral i.e. the chance of failure
This describes situations where the campaign did not reach critical mass, and the content withered and died. Knowing this value, we can change our number of initial contacts to avoid it.
The maximum number of people who will see the content
This enables us to forecast the likely size and success of the campaign. The absolute total is simply our estimate of the market size: this figure is the maximum simultaneous number of people reached – those actively sharing or viewing the content at one time.
The equations needed to arrive at these values are:
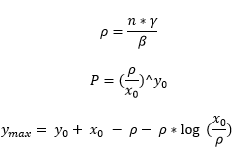
Where:
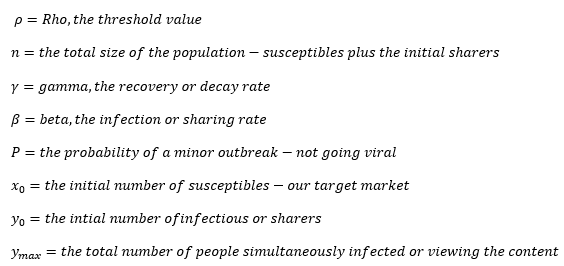
The value ρ describes the threshold value for the initial number of susceptibles. If an infection is introduced, then the number infected decreases and the infection dies out – our campaign has not gone viral.
Conversely, if the number of infectives builds up, an epidemic breaks out – this means we’ve got a successful campaign on our hands. For more information on how these equations are derived, check out the following sources:
Step 4: plug in your numbers
Using the figures we arrived at earlier and assuming we share the content initially ourselves without any assistance (y_0=1), we have:
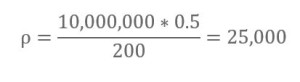
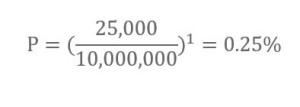
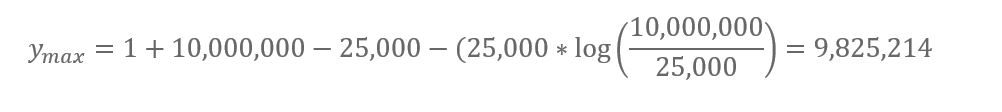
So we have a potential maximum audience of 9.8 million, and a very low chance of failure. This is due to the high sharing rate. The chance of failure can be further reduced by increasing the number of initial seeds for the content.

Using our proprietary LinkLab Media Relations Software, we initially targeted 30 sites with this content. This gave us the figures below:
| No. of Sources | Share Rate | Decay Rate | Size of Population | Epidemic Parameter | Chance of Minor Outbreak | Maximum Views |
| 30 | 200 | 0.5 | 10000000 | 25000 | Negligible | 9909949 |
So, it seems that 30 initial sites will be enough to ensure our content goes viral. Of course, that makes it sound very simple to do, but this is based on our estimated parameters – if our share rate is not 200, or our decay rate is higher, we will not achieve these figures. As ever, the quality of the content will dictate what happens.
Results
We reviewed the performance of our piece of content and found it achieved an estimated 6.05 million views. Working backward from the numbers reported, we can update the above table with what we observed:
| No. of Sources | Share Rate | Decay Rate | Size of Population | Epidemic Parameter | Chance of Minor Outbreak | Maximum Views |
| 53 | 283 | 0.5 | 10000000 | 17668 | Negligible | 9933696 |
This content received 53 pieces of coverage and links, which were shared over 15,000 times – a share rate of 283. A share rate this high leads to a very large audience size.
These numbers show that the campaign was highly successful, and achieved our objective of producing a ‘viral’ campaign.
| No. of Sources | Share Rate | Decay Rate | Size Of Population | Epidemic Parameter |
Chance of Minor Outbreak |
Maximum Views |
| 1 | 200 | 0.5 | =10000000+RC[-3] | =RC[-1]*RC[-2]/RC[-3] | =(RC[-1]/RC[-2])^RC[-5] | =RC[-6]+RC[-3]-RC[-2]-RC[-2]*LOG(RC[-3]/RC[-2]) |
Above are the formulae required, adapted to be used in Excel. By plugging in different values for the number of sources, share rate, decay rate, and size of population, you can see how the % chance and maximum number vary. Notice what has the biggest impact on the maximum number – the decay rate, and the biggest impact on the chance of minor outbreak – the share rate.
Summary (and don’t forget the quality of the content!)
This model is a simple approximation of a viral marketing campaign that helps to define some key considerations:
- How many publications should I contact at the start of the campaign?
- Which are the right publications to seed my content?
- How can I increase the share rate?
- How can I reduce the decay rate and prolong visibility?
You can prepare all the publications and work out your numbers, however, the key to the success of the campaign was – and always will be – the quality of the content.
How we can help your campaigns go viral
OK, so we can’t guarantee that any campaign will definitely go viral (and don’t believe anyone who tells you they can), but our methodology has delivered some great successes with our clients (including this one).
If you’d like to talk to us about how we can increase the odds of your campaign going viral, please contact us and we’ll be happy to share our experience.