How to use GA 360 data and BigQuery’s Geography functions to determine if proximity to a physical store influences online user behaviour
BigQuery’s Geographic functions provide a simple way to measure the distance between a session location and a physical location. We can use this data to analyse if conversion rate is influenced by proximity to a store.
Here we will walk you through how to run an analysis to test this for your own brand.
Pre-requisites
In order to run this test, you will need to have:
- A list of physical store locations with the latitude and longitude of each
- Google Analytics 360 (GA 360) session data, exported to BigQuery tables.
If you don’t know the latitude and longitude of your stores, there are free mapping websites that can identify them for you.
You will also need to know how to both import your store list into BigQuery, and how to run queries against data in BigQuery in order to run this analysis. If you’re unsure how to do either, Google has some easy to navigate walk throughs here.
Building the query
In this guide, we have built up the query in stages using a WITH clause to alias each sub-query. This allows us to explain the reasoning behind the method, making it easier to replicate.
However, we have also provided the full query at the end of the guide which can be copy and pasted with only minimal changes required, should you wish to head straight there.
Step 1 – Importing store locations to BigQuery
To run this analysis, you will need to have your list of store locations with latitude and longitude values in a BigQuery table, ensuring that the fields are labelled as latitude and longitude respectively. If you have this list of store locations in a local file, you can follow this guide to import it correctly.
Step 2 – Extracting the latitude and longitude values
The first sub-query you will need to do is extracting the latitude and longitude values for each store:
[sql]WITH StoreLocations AS (
SELECT
store_name as store,
latitude as lat,
longitude as long
FROM `your_project.your_dataset.your_store_list_table`
)[/sql]
The data returned will look like the following:
| store | lat | long |
| Leeds | 53.8008 | -1.5491 |
| Manchester | 53.4808 | -2.2426 |
| Cardiff | 51.4816 | -3.1791 |
| Norwich | 52.6309 | 1.2974 |
Step 2 – Identifying session locations
Next, you need to extract the latitude and longitude of session locations. This data is available using the geoNetwork.latitude and geoNetwork.longitude fields in the GA360 BigQuery Export.
[sql]WITH SessionLocations AS (
SELECT
CONCAT(
CAST(visitId AS STRING),
“.”,
CAST(fullVisitorId AS STRING)
) AS sessionId,
ANY_VALUE(
CAST (geoNetwork.latitude AS FLOAT64)
) AS latitude,
ANY_VALUE(
CAST (
geoNetwork.longitude AS FLOAT64
)
) AS longitude
FROM
`your-project-id.your-dataset-id.ga_sessions_*`
WHERE
_TABLE_SUFFIX BETWEEN ‘20171201’
AND ‘20181130’
AND geoNetwork.latitude != ‘0.0000’ GROUP BY sessionId
)
[/sql]
The first few results of this query look a little like this:
| sessionId | latitude | longitude |
| 1543771226.77848 | 51.5074 | -0.1278 |
| 1543762386.56107 | 53.796 | -1.7594 |
| 1543719115.29403 | 55.8642 | -4.2518 |
| 1543782918.54377 | 53.1269 | -1.2625 |
Note that:
- In order to get a unique session id column we need to combine visitId and fullVisitorId which I have done by simply concatenating these values separated by a full-stop
- Occasionally no location can be found for a session which shows up as a value of ‘0.000‘ in the latitude & longitude fields in the export. These will need to be filtered out
- geoNetwork.latitude and geoNetwork.longitude fields are stored as strings so we CAST them to FLOAT64
- In this example we filtered the sessions to the year ending 30th November 2018.
Step 3 – Calculate the distance to the nearest store
Once you have extracted the latitude and longitude for physical locations and sessions, you will need to calculate the distance between each session and the nearest store. This can be calculated via BigQuery’s Geography functions using the following function:
[sql]ST_DISTANCE(
ST_GEOGPOINT(
SessionLocations.longitude, SessionLocations.latitude
),
ST_GEOGPOINT(
StoreLocations.long, StoreLocations.lat
)
)
[/sql]
Calculate the distance from each store to each session using a CROSS JOIN, and then GROUP BY sessionId taking the minimum of each calculated distance in order to find the nearest store as follows:
[sql]WITH DistanceToNearestStore AS (
SELECT sessionId,
MIN(
ST_DISTANCE(
ST_GEOGPOINT(
SessionLocations.longitude, SessionLocations.latitude
),
ST_GEOGPOINT(
StoreLocations.long, StoreLocations.lat
)
)
) * 0.000621371 AS distance – – convert meters to miles
FROM
SessionLocations CROSS JOIN StoreLocations GROUP BY sessionId
)
[/sql]
This will map out the sessionId to distance from the nearest store location:
| sessionId | distance |
| 1543771226.77848 | 50.005559 |
| 1543762386.56107 | 30.792333 |
| 1543719115.29403 | 66.11263 |
| 1543782918.54377 | 115.960936 |
Step 4 – Calculating the conversion rate
In this example, we have defined a conversion as any session with a transaction. However, you can choose what to use here according to the definition of conversion you would like to measure.
In our case we check if the transactions count is greater than zero using this expression:
IFNULL(totals.transactions, 0) > 0
Note that we have used the IFNULL operator in this example – this is because BigQuery returns a NULL value, rather than a zero in cases where a session has zero transactions.
Pull this in using an INNER JOIN from the original export, to the SessionLocations:
[sql]SELECT sessionId,
distance AS distanceToNearestStore,
IFNULL(totals.transactions, 0) > 0 AS hasConverted
FROM
`your-project-id.your-dataset-id.ga_sessions_*` INNER
JOIN DistanceToNearestStore ON DistanceToNearestStore.sessionId = CONCAT(
CAST(visitId AS STRING),
“.”,
CAST(fullVisitorId AS STRING)
)
WHERE
_TABLE_SUFFIX BETWEEN ‘20171201’
AND ‘20181130’
[/sql]
The result should look like the following:
| sessionId | distance | hasConverted |
| 1543771226.77848 | 50.005559 | False |
| 1543762386.56107 | 30.792333 | True |
| 1543719115.29403 | 66.11263 | False |
| 1543782918.54377 | 115.960936 | False |
Step 5 – Aggregating values by distance
There are two main ways you can aggregate these values by distance:
- You can manually choose aggregation ‘buckets’ based on human intuition. For example, you may want to test if there is a difference in conversion rate for sessions within five miles of a store
- You can divide the data up into segments automatically, plot it out and identify any trends.
Manually chosen distance buckets
For this method, you need to:
- Define a sub-query with our distance buckets and their thresholds
- Do a CROSS JOIN to our session conversion data then filter rows where the distance is outside the threshold
- GROUP BY ‘bucket’, then COUNT the sessions and SUM the conversions in order to calculate the conversion rate.
It is important to ensure that you only allocate each session to one distance bucket; it’s easy to cross check the number of rows returned from this query against the ConveredByDistance sub-query to make sure this is the case.
[sql]Thresholds AS (
SELECT
‘1. Within 1 Miles’ AS distanceBucket,
0 AS minVal,
1 as maxVal UNION ALL
SELECT
‘2. Between 1 and 5 Miles’ AS distanceBucket,
1 AS minVal,
5 AS maxVal UNION ALL
SELECT
‘3. Between 5 and 10 Miles’ AS distanceBucket,
5 AS minVal,
10 AS maxVal UNION ALL
SELECT
‘4. Between 10 and 25 Miles’ AS distanceBucket,
10 AS minVal,
25 AS maxVal UNION ALL
SELECT
‘5. Over 25 Miles’ AS distanceBucket,
25 AS minVal,
CAST(‘+inf’ AS FLOAT64) AS maxVal
),
ConversionBuckets AS (
SELECT
distanceBucket,
COUNT(1) as sessionCount,
SUM (
CAST (hasConverted AS INT64)
) as conversionCount
FROM
Thresholds CROSS JOIN ConvertedByDistance WHERE distanceToNearestStore >= minVal and distanceToNearestStore < maxVal
GROUP BY
distanceBucket
)
SELECT
distanceBucket,
sessionCount,
conversionCount,
conversionCOunt / sessionCount as conversionRate FROM ConversionBuckets ORDER BY distanceBucket ASC
[/sql]
This query will return your final results:
| distanceBucket | sessionCount | conversionCount | conversionRate |
| 1. Within 1 Miles | 13453322 | 421148 | 0.031304 |
| 2. Between 1 and 5 Miles | 1457340 | 45268 | 0.031062 |
| 3. Between 5 and 10 Miles | 2638155 | 89445 | 0.033904 |
| 4. Between 10 and 25 Miles | 3197742 | 104457 | 0.032666 |
| 5. Over 25 Miles | 429943 | 14556 | 0.033856 |
Automatically calculated distance buckets
This method has a different approach to deriving the Thresholds sub query:
- Use BigQuery’s APPROX_QUANTILES() function to split your set of distances into quantiles. For this example I have split it into 32 quantiles
- UNNEST this array and use the RANK() function to number each row
- Having numbered each row, you can now INNER JOIN this sub-query to itself with a row offset. This will enable you to get an upper-bound and a lower-bound value from the set of quantiles
- Continue as before replacing the manually constructed Thresholds with your calculated ones.
For this approach, use the following Thresholds sub query:
[sql]Thresholds AS (
WITH Quants AS (
SELECT
ARRAY_CONCAT(
APPROX_QUANTILES(distanceToNearestStore, 32)
) AS quantiles FROM ConvertedByDIstance
),
T AS (
Select
flattened as val,
ARRAY_LENGTH(Quants.quantiles) As partition_count,
RANK() OVER (
ORDER BY
flattened ASC
) AS Rank
FROM
Quants INNER JOIN UNNEST(Quants.quantiles) as flattened
)
SELECT
CASE WHEN UpperBound.Rank = 0 THEN 0.0 ELSE LowerBound.val END AS distanceBucket,
CASE WHEN UpperBound.Rank = 0 THEN 0.0 ELSE LowerBound.val END AS minVal,
CASE WHEN UpperBound.Rank = UpperBound.partition_count THEN CAST (‘+inf’ AS FLOAT64) ELSE UpperBound.val END AS maxVal
FROM
T AS UpperBound
INNER JOIN T AS LowerBound ON UpperBound.Rank = LowerBound.Rank + 1
)
[/sql]
Note that we replace the first lower bound with zero and the last upper bound by infinity to ensure we do not miss any values as the original values returned from APPROX_QUANTILES are only approximate min and max values.
This query returns a table similar to the output from the manually chosen distance buckets, but has more data which allows you to visualise conversion rate by distance by plotting it on a scatter chart like this:
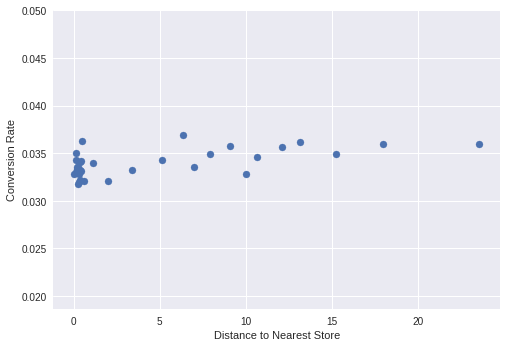
In this example, there was no clear trend between store proximity and conversion rate. However, it’s feasible that a trend may be spotted; for example, we might see online conversion rates drop as sessions become closer to physical stores with users more likely to pop into the store. Or, we might see higher conversion rates for sessions carried out near a store, as people see the physical store and decide to look online when they get home.
Either way, carrying out this analysis gives you the data to understand if you should remarket to these users differently or even tailor their on-site experience giving more prominence to in-store features or calls-to-action.
The complete query
As promised, here is the complete query you can use to calculate whether proximity to a physical store influences session behaviour.
In order to use this query, you will need to replace the table identifiers with your own table identifiers and uncomment the correct section for the Thresholds sub-query depending on whether you would like to use automatically calculated distance buckets or to define your own. You may also want to filter for certain dates.
[sql]WITH ConvertedByDistance AS (
WITH DistanceToNearestStore AS (
WITH StoreLocations AS (
SELECT
store_name as store,
latitude as lat,
longitude as long
FROM
`your_project.your_dataset.your_store_list_table`
WHERE
latitude > 0
),
SessionLocations AS (
SELECT
CONCAT(
CAST(visitId AS STRING),
“.”,
CAST(fullVisitorId AS STRING)
) AS sessionId,
ANY_VALUE(
CAST (geoNetwork.latitude AS FLOAT64)
) AS latitude,
ANY_VALUE(
CAST (geoNetwork.longitude AS FLOAT64)
) AS longitude
FROM
`your-project-id.your-dataset-id.ga_sessions_*`
WHERE
geoNetwork.latitude != ‘0.0000’
AND geoNetwork.latitude != ‘51.5074’
and geoNetwork.longitude != ‘-0.1278’
AND geoNetwork.country = ‘United Kingdom’
GROUP BY
sessionId
)
SELECT
sessionId,
MIN(
ST_DISTANCE(
ST_GEOGPOINT(
SessionLocations.longitude, SessionLocations.latitude
),
ST_GEOGPOINT(
StoreLocations.long, StoreLocations.lat
)
)
) * 0.000621371 AS distance
FROM
SessionLocations CROSS
JOIN StoreLocations
GROUP BY
sessionId
)
SELECT
sessionId,
distance AS distanceToNearestStore,
IFNULL(totals.transactions, 0) > 0 AS hasConverted
FROM
`your-project-id.your-dataset-id.ga_sessions_*`
INNER JOIN DistanceToNearestStore ON DistanceToNearestStore.sessionId = CONCAT(
CAST(visitId AS STRING),
“.”,
CAST(fullVisitorId AS STRING)
)
),
— Use this section for defined buckets:
—————————————-
— Thresholds AS (
— SELECT ‘1. Within 1 Miles’ AS distanceBucket, 0 AS minVal, 1 as maxVal UNION ALL
— SELECT ‘2. Between 1 and 5 Miles’ AS distanceBucket, 1 AS minVal, 5 AS maxVal UNION ALL
— SELECT ‘3. Between 5 and 10 Miles’ AS distanceBucket, 5 AS minVal, 10 AS maxVal UNION ALL
— SELECT ‘4. Between 10 and 25 Miles’ AS distanceBucket, 10 AS minVal, 25 AS maxVal UNION ALL
— SELECT ‘5. Over 25 Miles’ AS distanceBucket, 25 AS minVal, CAST(‘+inf’ AS FLOAT64) AS maxVal
— ),
—————————————-
— Use this section for calculated buckets:
——————————————-
Thresholds AS (
WITH Quants AS (
SELECT
ARRAY_CONCAT(
APPROX_QUANTILES(distanceToNearestStore, 32)
) AS quantiles
FROM
ConvertedByDIstance
),
T AS (
Select
flattened as val,
ARRAY_LENGTH(Quants.quantiles) As partition_count,
RANK() OVER (
ORDER BY
flattened ASC
) AS Rank
FROM
Quants
INNER JOIN UNNEST(Quants.quantiles) as flattened
)
SELECT
CASE WHEN UpperBound.Rank = 0 THEN 0.0 ELSE LowerBound.val END AS distanceBucket,
CASE WHEN UpperBound.Rank = 0 THEN 0.0 ELSE LowerBound.val END AS minVal,
CASE WHEN UpperBound.Rank = UpperBound.partition_count THEN CAST (‘+inf’ AS FLOAT64) ELSE UpperBound.val END AS maxVal
FROM
T AS UpperBound
INNER JOIN T AS LowerBound ON UpperBound.Rank = LowerBound.Rank + 1
),
——————————————-
ConversionBuckets AS (
SELECT
distanceBucket,
COUNT(1) as sessionCount,
SUM (
CAST (hasConverted AS INT64)
) as conversionCount
FROM
Thresholds CROSS
JOIN ConvertedByDistance
WHERE
distanceToNearestStore >= minVal
and distanceToNearestStore < maxVal
GROUP BY
distanceBucket
)
SELECT
distanceBucket,
sessionCount,
conversionCount,
conversionCount / sessionCount as conversionRate
FROM
ConversionBuckets
ORDER BY
distanceBucket ASC
[/sql]