Back in August Google Analytics launched Multi-Channel Funnels. Multi-Channel funnels allow you to gain insight into the true value of all your marketing activities and build up a more thorough understanding of how users interact with your website over multiple sessions.
On the face of it, it looks fantastic, a big stride forward in my opinion. This is going to be really useful for all sorts of reasons. For agencies and in-house marketers alike, it will help justify exactly what they are getting back from their digital campaigns, whether it is SEO, PPC, Social or email.
There’s already been plenty written about the topic such as explaining the power of channel groupings by SharkSEO on SEOgadget. In it he explains how to set them up and suggests creating a ‘Brand Intention’ grouping which incorporates branded traffic from organic, cpc and direct. I found this very useful in establishing the true value of your incremental search traffic (traffic whereby the user was not directly looking for your site).
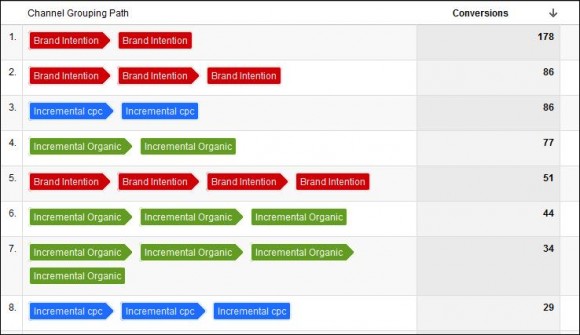
David Whitehouse also wrote a post reviewing Multi-Channel Funnels, he highlighted the value of the assisted conversions report in showing the wider role of SEO in conversion attribution, instead of just attributing the last click with the conversion. In it he was able to show £64k of revenue through SEO (last click attribution) and SEO contributing to a further £82k of revenue – meaning that SEO played a part in acquiring £146k worth of revenue.
This statement is absolutely true; however, if paid advertising also plays an ‘assist’ role in a number of those conversions, then the PPC guy will also be trying to claim some of that same revenue. Both the SEO and PPC guys would be correct in saying that their medium played a part in getting £x amount of revenue, but ultimately there will be no exact £ value that you could assign to either, as the numbers just wouldn’t add up.
This has led me to try and find out how we can assign a true value to each of the channels (or channel groupings), using attribution modelling. I’ve been able to produce a sheet in excel that can help work out the true value of each of these channels.
Here’s what I did:
Getting the data and formatting it
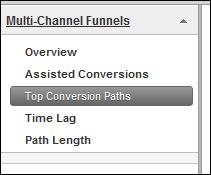
Select the ‘Top Conversion Paths’ report in the Multi-Channel Funnels section of GA.
Select a single conversion (not all) and all path lengths (default is set to two).
Using the channel groupings function, you can split up the traffic however which way you want. As mentioned previously, I used the great tips in SharkSEO’s article on SEO Gadget, to split out branded traffic from both organic and cpc, and placing it together with Direct to create a ‘Brand Intention’ grouping.

Make sure you extend the number of rows showing to the maximum, so you have all channel grouping paths showing in the table, then export to ‘CSV for excel’.
Unfortunately at the moment the new version of GA doesn’t export as smoothly and its previous guises. It all comes out in just the one cell, so we have to reformat the data ourselves in order to get to work on the good stuff. Maybe this will get fixed when the new interface comes out of beta, but until then we will have to do the following:
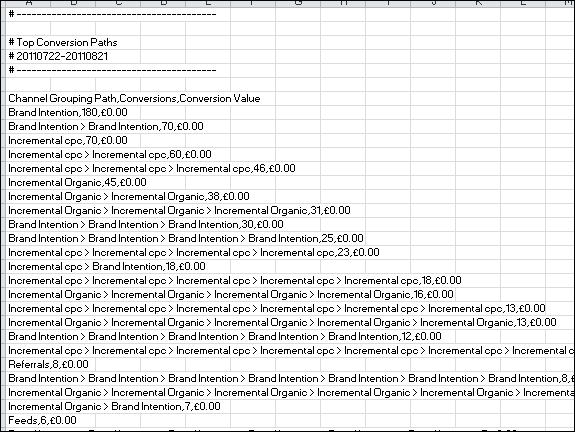
First of all we need to separate conversions & conversion value. The ‘Text to Columns’ function in excel is great for this reformatting. Just separate the conversion data from the channel grouping path (delimit using commas).
We then need to formalise the grouping path data and remove all the white space, using find and replace (find on a ‘space’, replace with nothing).
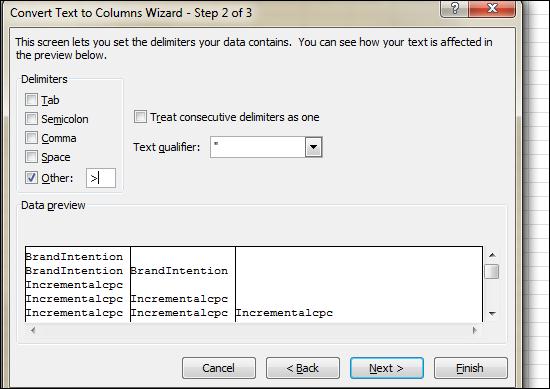
We then need to split out all the groupings from one another using the ‘Text to Columns’ function again. This time delimiting using ‘Other’ and specifying ‘>’ (see below). This will split out all the data into separate cells.
Conversion attribution for each channel
Once you’ve got this data, you can then play around in excel to find the true value of your channels. You can do this in any number of ways. In the following analysis I chose to use three separate attribution models and compare them:
- Linear Attribution – Whereby each step in the path is given equal credit.
- First Click Attribution Weighting – 50% credit goes to the first click, the remaining 50% credit is split equally between the other steps in the path.
- Last Click Attribution Weighting – 50% credit goes to the last click, the remaining 50% credit is split equally between the other steps in the path.
Using a test dataset it was apparent that there wasn’t a great deal of difference in revenue between some of the models.

These weightings are just arbitrary, so you may want to use different weightings in your own analysis.
I’ve produced a conversion attribution cheat sheet that you download here. You can then paste in your own data. You will need to edit the following:
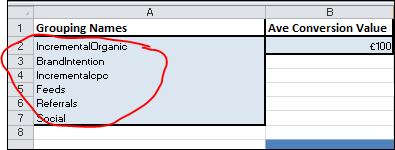
- Channel Grouping names (must have no spaces) – these names must match the channel grouping names exactly.
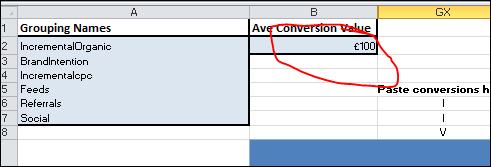
- Average Conversion Value – input your average conversion value
- # Conversions – Paste in from GA export
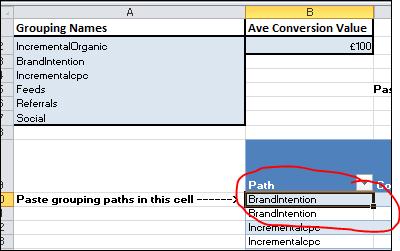
- Channel Grouping Paths – Paste in your paths in the Linear Model tab (in the box shown below)
When the data has all been pasted into the ‘Linear Model’ sheet – then just make sure that in the ‘First Click Weighting’ and ‘Last Click Weighting’ sheets, that the table range is dragged down to the same row number as the data extends to in the ‘Linear Model’ sheet.
Limitations
This sheet was designed as a basic level of this type of analysis. I’m sure that more excel savvy people will be able to take the principles highlighted in this post and build upon it. You may wish to consider the following when using my example sheet:
- All references to channel groupings (including column headings) must match your channel grouping names exactly.
- Without editing, this sheet can only handle path lengths of 204 steps – it will break unless you amend the sheet.
- I’ve used an average conversion value, which means that it would be more accurate to use just one type of conversion at a time. For ecommerce sites I would recommend using actual conversion value (this will require you to ‘paste values’ the conversion value in the ‘Total Revenue’ column manually).
- At the moment the sheet will only handle six channels / channel groupings
Summary
In summary Multi Channel Funnels is without any shadow of doubt, a major step forward for GA and I feel that this is really going to help digital marketers out with many issues, the most important being:
- Help report on and prove the true benefit that a particular channel or channel grouping is having for them.
- Address the issue that’s dogged us for some time. Easily measuring the impact of social and its part in contributing to conversions.


