Since Google bought Urchin in 2005 and rebranded it Google Analytics (GA) it has been transformed from a ‘great free tool’ for smaller websites into a class-leading enterprise solution.
It is simple to install the basic setup by pasting a snippet of code on all pages, but this only scratches the surface of the features it provides, or the insights it gives you.
We thought it was about time we reviewed some of many advanced features that are available in GA, and have drawn up a list of ten of the most powerful.
Whilst not exhaustive, this provides an initial checklist for more advanced marketers and your teams, and will help ensure that you are optimising your Google Analytics to track the activities and outcomes that are critical to your business.
4. Custom dimensions and metrics
8. Measurement protocol (integrating offline systems, such as a CRM)
1. Enhanced Ecommerce
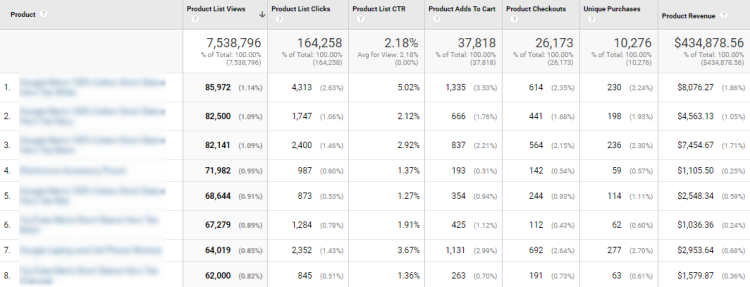
The basic setup of GA will give you some incredible reports, but they all revolve around pageviews. For ecommerce websites, the main entity website owners are interested in are products. Enhanced Ecommerce adds a new set of reports, dimensions and metrics that place the product at the centre of the tool, allowing you to understand the following:
- Impressions – Where people are seeing your product around the site within lists such as category pages.
- Clicks – How popular these product impressions are within the above lists. Having information on Click Through Rates (CTRs) gives you powerful information about what products you should be promoting.
- Product views – Information about the products people are viewing. Knowing this helps you prioritise your efforts and gives powerful information when viewed alongside the other data points in this section.
- Add and remove from carts – When seen alongside product views this gives an engagement metric that will provide insight into how popular certain products are.
- Checkout funnel – You can now set up a funnel to the transaction without having to create a separate goal and funnel as you used to.
- Transactions – Not new, but a key report.
- Refunds – You can now track refunds and partial refunds against transactions. Something that may be particularly important in certain sectors, such as fashion.
Furthermore, when all of the above information is viewed alongside each other it provides a true view of the sales funnel at a product or category level, as shown on the screenshot below.
For more information, you can read Enhanced Ecommerce help page and the developers’ guide.
2. Events
The standard GA setup will track pageviews on your website each time a page loads. But there is so much more that goes on during a visit that you may be missing: you can use the Events feature to track these non-pageview types of activity.
To track events on your website you have to make some customisations to execute a javascript function that sends this additional information to GA. This looks something like the following, where the final three parameters are information specific to the event you are tracking:
![]()
You can track anything you like with events, but some common examples are:
- Javascript engagement (for example on a product page with JS tabs)
- Video engagement (play, stop, 25% viewed etc..)
- Form submission
- Offline activity (using the measurement protocol)
- Scroll depth (i.e. how far down the page you scrolled)
- Outbound clicks (to other sites)
- PDF downloads
3. User ID tracking
This feature was a significant jump forward from GA when it was released. It allows you to output your own userID when a user is logged in, which then joins all their sessions together, even when they delete cookies, or – importantly – when they use different devices to access your site.
This is an absolute must if your site provides the ability to log in and if your customer journeys span multiple devices (which, let’s face it, is pretty much every site these days!).
This lets you see just how often people are flipping from device to device in the lead up to converting on your site, and lets you know the importance of different devices so you can flex your marketing campaigns to drive traffic from those that will provide the best return on investment.
4. Custom dimensions and metrics
GA tracks loads of dimensions and metrics out of the box, but you can customise these to track the dimensions and metrics that are important to your business. A custom dimension or metric is basically applied by ‘marking’ the standard tracking hits you send to GA, for example, pageviews and events.
Below are some real-life examples of what you could use these for:
Enquiry forms – You could send these as events but ‘attach’ a dimension or metric against it to show information about that enquiry such as value, product/service, or type of enquiry.
Logged-in users – If your customers log in, or otherwise have to ‘say who they are’ (such as during an ecommerce purchase), then you can output dimensions and metrics to enrich the information you have about that user and the hits and sessions they make. For example:
- Customer spend to date
- UserID
- Previous transactions
- Some other internal CRM segments that you define.
Transaction and goals – You can mark certain metrics against a transaction to provide more information. For example:
- First Time Transaction/New Customers (a metric of ‘1’ each time this occurs)
- Account Creation (metric)
- Type of customer (e.g. credit or cash)
Having all these custom pieces of data allows you to do some powerful analysis using segments and reporting, but also allows you to define remarketing audiences that you can then target with laser-focused marketing campaigns in AdWords or DoubleClick.
5. Google Tag Manager
![]()
Search Laboratory is a certified Google Tag Manager partner and whilst this isn’t a feature of Google Analytics, I can’t imagine why you wouldn’t install GA using this. A tag management solution like GTM provides some huge benefits such as the following:
- Less web developer time needed – It takes the burden away from developers (and their associated costs, lead times and processes) and gives it to you, the marketer.
- Speed – The turnaround time for installing a tag can be minutes.
- Cost – The above two points mean it is much more effective and efficient.
- Power features – This whole article discusses the power features of GA. Using a tool like GTM makes it a thousand times easier to implement these features. Specifying complex GA customisations to developers is hard, time-consuming and often a barrier to most people doing it at all.
- Inbuilt templates – GTM has some great tag templates that make implementing tags seriously less error-prone and much simpler.
- Self-documenting – Web tracking tags can get very complex. On a website that has a history of a few years and a handful of agencies, it is easy to lose track of which tags are where. With a sensibly structured GTM, you can quickly see what you have, and make changes as appropriate.
6. Segments
Generating the data is only part of the equation: understanding it, and knowing what to do with it, requires being able to generate actionable insights. To gain actionable insights you need to understand the different types of users that are visiting your site, and to define segments that help you to understand what different type of users are (or are not) doing.
GA provides the ability to filter the reports based on sessions or users that meet certain criteria. You can also define users or sessions that follow a certain sequence of events.
So you might want to see what the group of people that made first-time visits by Google/CPC in January (a cohort) went on to do over the course of the year. Or you might want to segment buyers that bought things, so you can understand what they did and try and ensure those that didn’t buy come back in the future.
Whatever type of activity analysis is appropriate for your business, you can use segments to generate the insights you need to make effective changes.
7. Audiences
Audiences are a powerful feature that can be linked to your AdWords account to be used in Remarketing Lists for Search Ads campaigns or Google Display Network Campaigns. If you have Google Analytics 360 you can also link to your DoubleClick account for remarketing campaigns.
You can define an audience in a similar manner to a segment by filtering users based on certain criteria. You can then feed this audience into your AdWords or DoubleClick account. This means you can then either adjust bids for specific people on your RLSA search campaigns, or show specific display ads via GDM (or DoubleClick if you have GA 360) to certain groups. Equally, you can exclude certain people from your campaigns, for example, if they have already bought something.
For example, you could define an audience of someone that searched for a product that has not been released yet, and then remarket to them heavily when the product release date approached.
8. Measurement protocol (integrating data from offline systems, such as a CRM)
When there is a lot of activity that occurs offline, you can use Measurement Protocol to pull in data from offline systems, such as customer relationship management software. We use this for our own Salesforce implementation, and it lets us know what happened to leads or enquiries that were generated online.
This approach is especially true for:
- Lead generation websites.
- B2B where the sales process occurs offline, or over a lengthy period.
- Consumer businesses where you have a high street presence or sell over the phone, or by mail.
- Free sign up/Trial models, where the commitment to buy may happen in the future and on a different computer, or offline.
In circumstances where sales (or other events) occur offline, you can implement the measurement protocol to push information to GA from your server, or other networked technology.
For example:
- A retail store might push sales that are made against a user by linking information they ask for at POS or using a loyalty card.
- A B2B lead generation could push information about events that occur during the sales process. For example, lead validated (i.e. spam removed), 1st meeting, opportunity created, sale or contract signed.
The key to implementing the measurement protocol to provide the most benefit is to ensure that some ‘key’ is available to join the offline and online activity. This is either by passing Google’s own internal ID that GA creates back to your CRM when a lead is submitted, or ensuring your own CRM ID is output on all possible sessions online.
Read a detailed case study on integrating offline data.
9. Content groupings
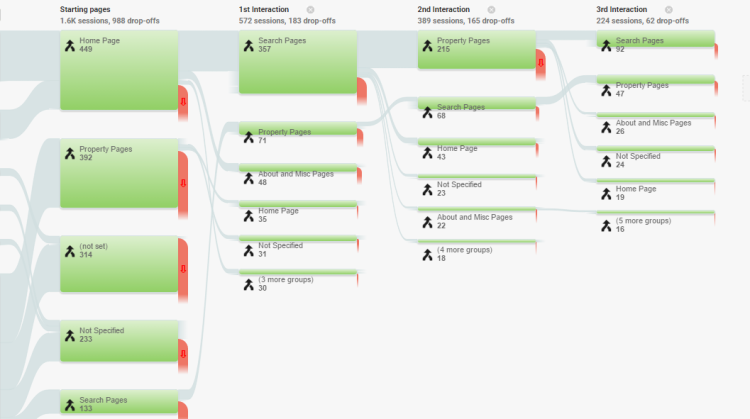
Some large websites have millions of pages. Being able to understand and view such large volumes of pages is just not possible and so GA has provided the ability to be able to ‘mark’ each page into a group name, so you can see the collective aggregated metrics for the group.
For example, you might create a group for ‘page type’, and populate each page with values like ‘home’, ‘category page’, ‘search results pages’, ‘product page’, ‘checkout pages’, ‘about pages’ etc. You might also group pages by their top-level categories, for example, ‘homeware’, ‘electrical’, ‘clothing’ etc..
In addition to making the main content reports much more digestible, it also makes some of the previously unusable reports very insightful. For example, below is an example of the ‘behaviour flow’ report with the groupings applied.
10. Data import
Initially, the only ways you could get data into GA was via a visit to a website, or through the app tracking library. Google now have a host of different methods for importing data into GA and some of these are as shown below:
- Refund data – If you are using Enhanced Ecommerce, then you can process refunds via periodic batch uploads.
- User data – If you are sending your internal userID with the tracked hits on the website with the log-in details, you can upload additional information about your users which then populates that information in your GA reports. You can do this with customer segments or previous purchases, for example.
- Cost data – This is information about the spend and impressions from other marketing sources. Linking AdWords automatically gives you this information, but you can also see this for other marketing channels, such as Bing.
- Custom data – You can ‘widen’ the data that gets associated with hits in GA if there is a ‘key’ to associate the two data sets. For example, let’s say you created custom dimensions for blog posts in the form of post ID, post author and post publish date. If you only track the post ID on your website, you can upload a table with the rest of the information and it will fill out this extra information in your reports.
There are also several more upload types so check out this information from Google to find out more.
Search Laboratory and Google
Search Laboratory is a Google Premier Partner and is accredited for the following Google solutions.

Want to learn more about setting up advanced Google Analytics features?
Search Laboratory has over ten years’ experience of setting up advanced analytics for some of the world’s leading brands, and has a dedicated in-house team able to set up your analytics for single language or multilingual websites.
Contact us now to set up a call with one of our data and analytics consultants.